
Bolt a GPS antenna to bedrock near Hudson Bay and leave it there for years. Its position can show a surprising trend. The rock itself is climbing. Across parts of the region, researchers have measured uplift of about a centimetre a year. The great ice sheet that supplied the original weight has long since disappeared. What the antenna records is the much slower response of the ground beneath it.[1, 2]
During the last ice age, ice accumulated over a vast area of northern North America. The load depressed the land and displaced material deep beneath it. As the ice thinned and retreated, the load came off. Rock can bend elastically, and hot rock in the mantle can also deform and flow very slowly over long periods. The solid Earth is still adjusting to that redistribution of weight. Geologists call the process glacial isostatic adjustment.[1, 2]
How ice can move the rock underneath a continent
A useful way to grasp the size of the load is to picture a square metre beneath one kilometre of ice. The column above it would contain a thousand cubic metres of ice. With a density of roughly 900 kilograms per cubic metre, that amounts to about 900 tonnes resting above a patch the size of a tabletop. That is an illustrative calculation for one column. An ice sheet distributes loads of that order over a region, with thickness varying from its centre to its margins.
The outer rocky shell responds over an area wider than any one column. Under the thick part of the ice it bends down. Material at depth can move away from the loaded region, and a broad area beyond the main ice load can be raised into what scientists call a forebulge. A map of the resulting deformation would include a low area and a raised margin. It would look quite different from a map showing only where ice touched the ground.[1]
Once the ice melts, part of the adjustment is rapid. Another part takes thousands of years because material deep in the Earth moves slowly under the changed stresses. A solid sample of rock that supports your weight today can deform on the timescale of an ice age. The long delay between unloading and recovery is why positions measured by satellite receivers today still carry information about a vanished ice sheet.[1, 2]
Why some places rise while others sink
Imagine following a line south from an area that carried thick ice toward a former forebulge. The first stretch crosses land that was depressed. As the old load is removed, much of that ground moves upward. Farther along, the line reaches ground that had been pushed up. The decay of that bulge can move the land downward. Opposite motions at the two ends of the line can therefore have a common cause.[1, 2]
A GPS study across North America found its strongest upward velocities near Hudson Bay, a region that had borne thick ice. The broad pattern across many stations mattered. A lone receiver on a settling building could produce a vertical trend for a very local reason. Stations distributed across a continent allow researchers to compare the centre, margins and areas farther away. Their results can then be checked against predictions based on ice history and the structure of the Earth.[2]
There is a similar effect south of the former ice margin in the eastern United States. NOAA identifies the collapse of the former forebulge as one contributor to subsidence around Chesapeake Bay. Local geology and other causes of subsidence still matter. The old ice sheet helps explain why a coastal community far from Hudson Bay can have a present-day vertical motion with the opposite sign.[1]
What a tide gauge adds to the GPS record
A tide gauge attached to a pier measures water height relative to a reference on land. If the water surface climbed three millimetres in a year while the rock supporting the pier rose eight, the gauge would register a relative fall of five millimetres. Those numbers are a worked example. They show why a record of the sea falling relative to one coast can coexist with a rising ocean surface.[3]
The distinction becomes important wherever people approach water over gently sloping land. Suppose a bare rock shelf rises one metre along a horizontal distance of one hundred metres. A relative fall in water level of ten centimetres could move the still-water intersection roughly ten metres across this ideal shelf. A near-vertical cliff would show very little horizontal change for the same vertical fall. A shore can thus look dramatically different from an equally fast-rising neighbour.
ClimateData.ca identifies parts of the Hudson Bay region where projected land uplift can outpace sea-level rise. These are regional projections, and the balance depends on place and time. A historical uplift rate alone cannot give a future shoreline. You also need the local water-level change, the slope of the ground and, for a real coast, information about what waves and sediment do along the edge.[3]
What a former shoreline preserves
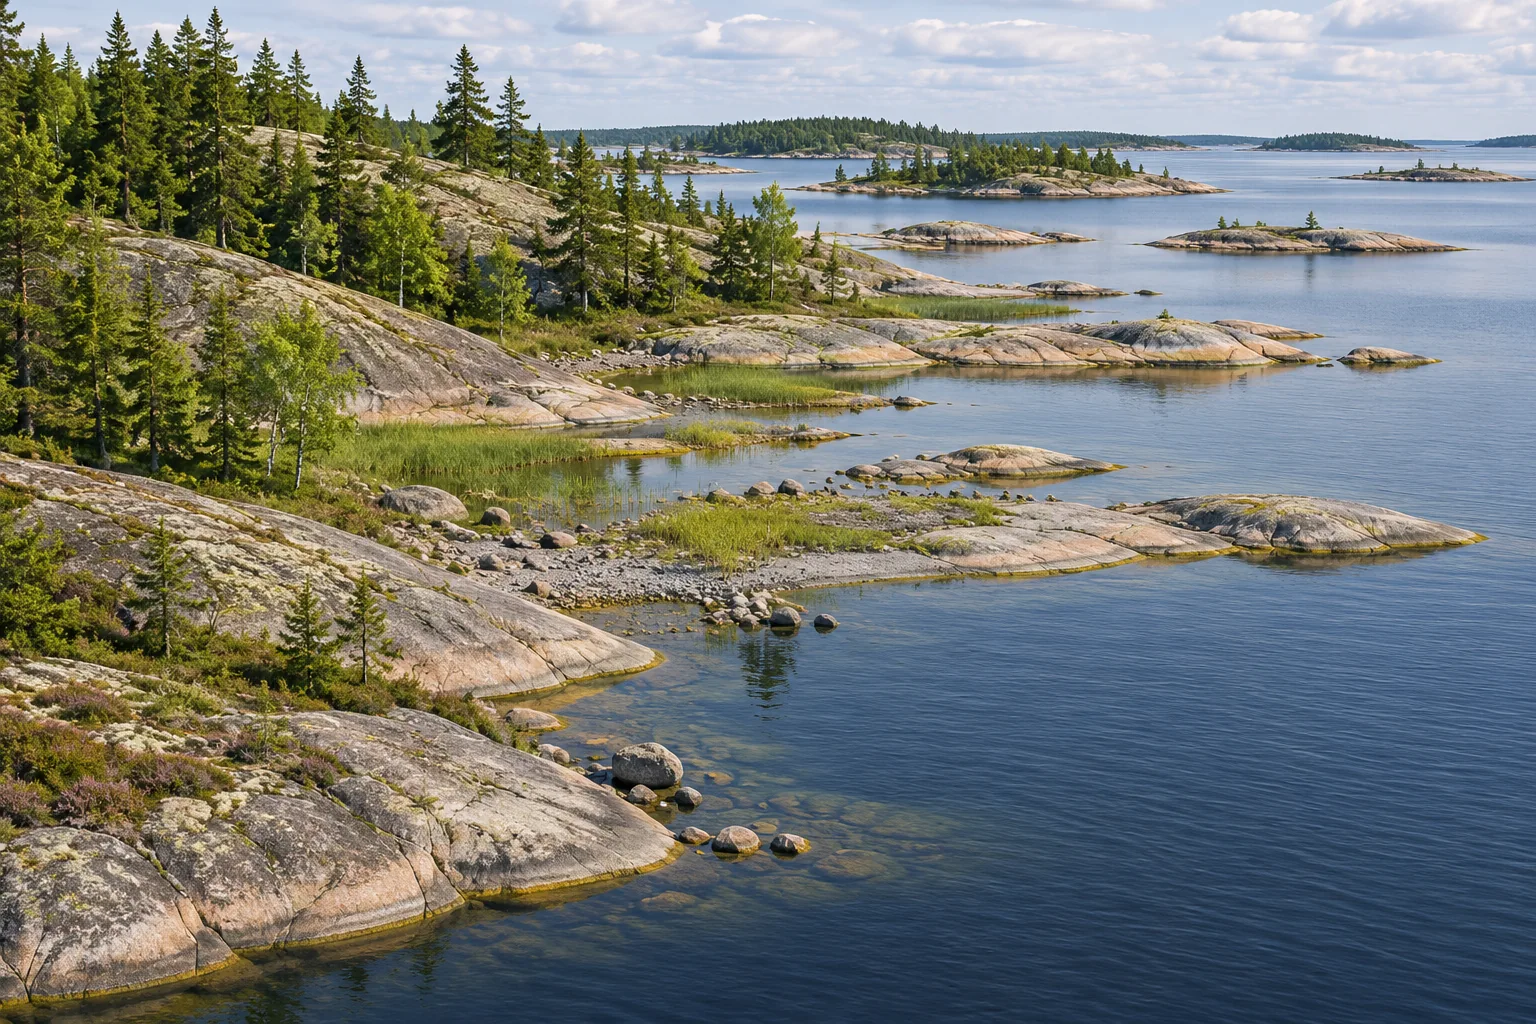
On the High Coast of Sweden and across the water in Finland’s Kvarken Archipelago, uplift has produced an especially readable landscape. Low islands emerge and join together. A narrow connection between a bay and the sea can become shallower until the basin is isolated. UNESCO describes a succession in which bays become lakes and eventually wetlands. A map of those water bodies can record the passage of a shoreline long after the waves have moved elsewhere.[4]
An abandoned raised beach and a modern receiver answer different questions. The beach records a former meeting of land and water. Its present elevation combines everything that has happened to both since then. A receiver records motion of its monument over the years of observation. Date a series of old shorelines and compare their elevations with the present trend, and the two records can constrain the history over quite different intervals.[2, 4]
A centimetre of movement in a single year is easily lost among the changes someone sees on an ordinary visit. The tide changes in hours, waves rearrange the beach, and the level of a snow-covered bank is hard to compare from one winter to the next. Bedrock stations and old shorelines give those observations a reference. Together they reveal a coast where removing the ice was one event and finishing the response to its weight is quite another.
Keep exploring
Follow the motion of the ice that supplied the load, then see how seismic waves reveal the rock beneath it.
Sources and further reading
- NOAA National Ocean Service — What is glacial isostatic adjustment?
- Sella and colleagues — Observation of glacial isostatic adjustment in stable North America with GPS
- ClimateData.ca — Guidance on Using Relative Sea-Level Change Datasets
- UNESCO World Heritage Centre — High Coast / Kvarken Archipelago
Keep exploring.
One remarkable idea at a time—nature, science, history and beyond.
Last updated November 19, 2026.

Barnakle Editorial Team
Barnakle Editorial Team is the collective byline used for Barnakle’s editorial articles. The contributor profile explains the team identity and links to the publication’s editorial policies.
More from the editorial team →