
A crystal’s journey through a cloud writes its shape
The short answer
A snow crystal begins when water vapour deposits as ice around a tiny particle in a cold cloud. The hexagonal arrangement of water molecules guides sixfold symmetry, while temperature and humidity along the crystal’s path control whether it grows plates, columns, needles or branching stars.
The explanation of how do snowflakes form becomes clearer when the process is followed in order: initial conditions establish what is possible, interactions change matter or energy, and the resulting structure leaves measurements that can be compared with predictions. That sequence is more reliable than a single slogan because it explains both the familiar result and the exceptions.
Scientists test claims about how do snowflakes form at several scales. Direct observations establish what happens, laboratory or computational models isolate mechanisms, and comparisons across environments reveal which factors matter most. Where evidence remains incomplete, this article distinguishes a working explanation from a settled measurement.
A snowflake starts as a crystal
In atmospheric science, a snow crystal is a single crystal of ice, while a falling snowflake may be one crystal or an aggregate of several. The distinction matters because the familiar fluffy clump and the symmetrical microscopic star are related but not identical objects.
In the context of a snowflake starts as a crystal, this evidence matters because it links an observable feature to a process that can be tested independently. A useful explanation also makes a prediction: changing the relevant condition should change the outcome in a specific direction.
For readers evaluating a snowflake starts as a crystal, the best question is not merely whether the claim sounds plausible, but what observation would distinguish it from a competing explanation. Here, the combination of structure, environment and measured response provides that test. The conclusion remains open to refinement without making the core evidence arbitrary.
Cold cloud does not mean instant ice
Liquid droplets can remain supercooled below 0°C. Ice formation usually begins around a suitable aerosol particle called an ice nucleus, or through interaction with existing ice. Cloud temperature, droplet availability and particle properties influence when the ice phase appears.
In the context of cold cloud does not mean instant ice, the important qualification is that one pattern can have several contributing causes, so context and scale must be recorded. Natural variation is informative rather than inconvenient, because limits and exceptions reveal which part of the mechanism is essential.
For readers evaluating cold cloud does not mean instant ice, the best question is not merely whether the claim sounds plausible, but what observation would distinguish it from a competing explanation. Here, the combination of structure, environment and measured response provides that test. The conclusion remains open to refinement without making the core evidence arbitrary.
Water vapour deposits onto ice
Once an ice embryo exists, water vapour can move directly from gas to solid at the crystal surface. In mixed-phase clouds, vapour may preferentially feed ice while supercooled droplets evaporate. This Wegener–Bergeron–Findeisen process helps crystals grow large enough to fall.
In the context of water vapour deposits onto ice, researchers therefore compare multiple lines of evidence rather than treating one striking example as the whole story. The chronology matters. Similar-looking endpoints can arise by different routes, and only dated or time-resolved evidence can separate them.
For readers evaluating water vapour deposits onto ice, the best question is not merely whether the claim sounds plausible, but what observation would distinguish it from a competing explanation. Here, the combination of structure, environment and measured response provides that test. The conclusion remains open to refinement without making the core evidence arbitrary.
Why six sides appear
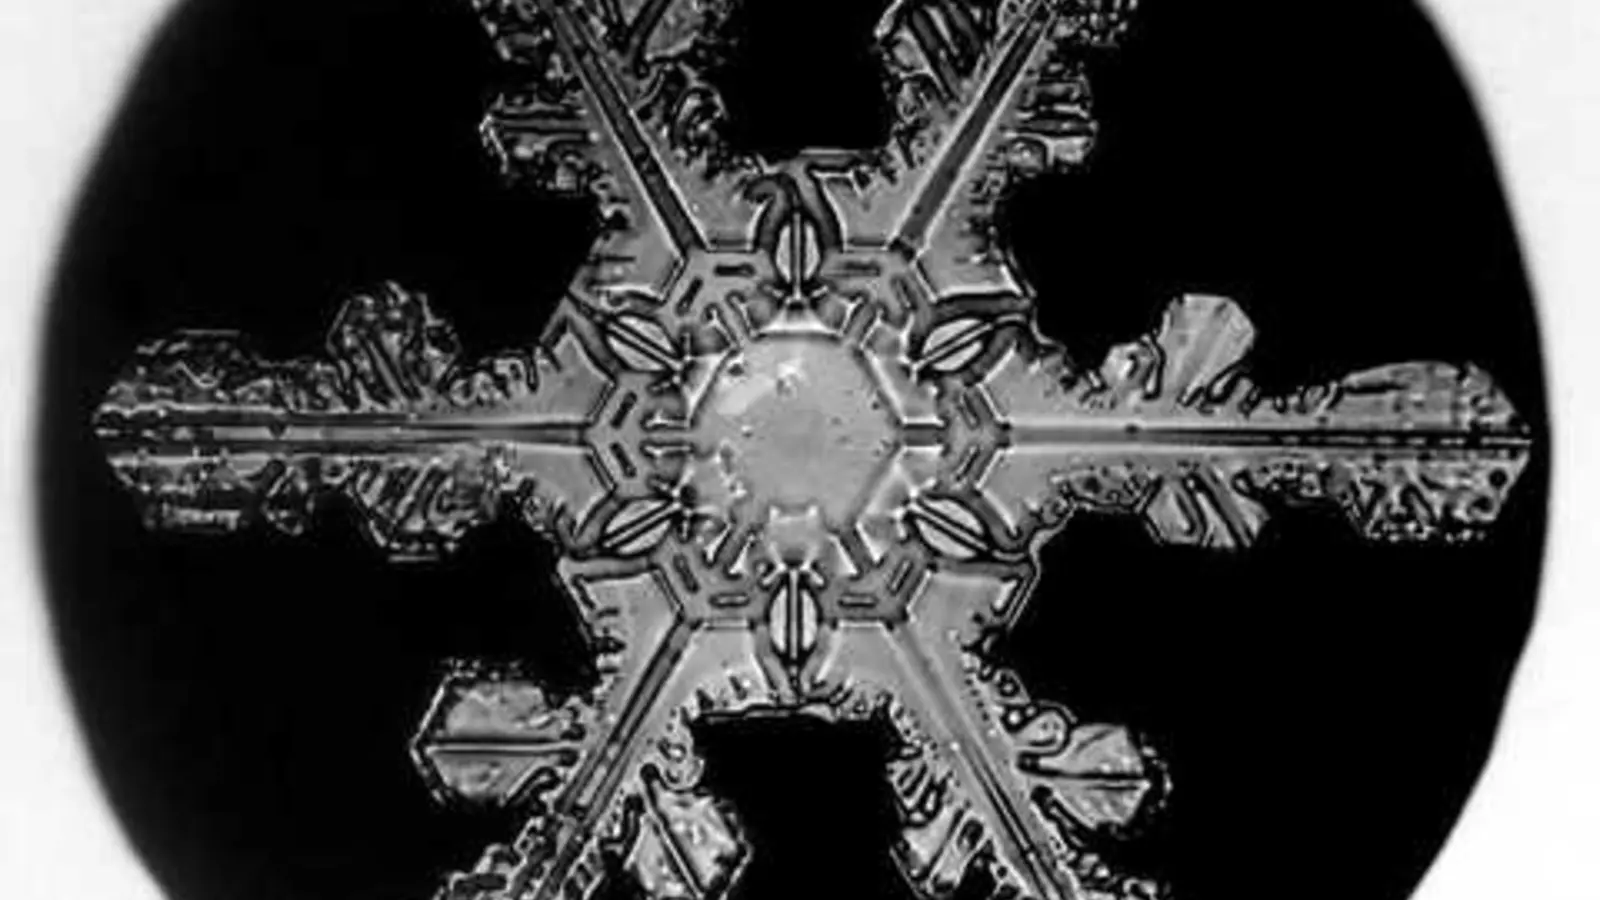
Ordinary atmospheric ice has a hexagonal crystal lattice. Molecular bonding makes growth directions repeat every 60 degrees around the main axis. Sixfold symmetry therefore comes from crystal structure, not from a template in the cloud or from six independent droplets colliding.
In the context of why six sides appear, seen this way, the feature is not an isolated curiosity but the outcome of physical and biological constraints acting together. Measurements are strongest when sampling, calibration and uncertainty are reported, allowing another team to check the inference.
For readers evaluating why six sides appear, the best question is not merely whether the claim sounds plausible, but what observation would distinguish it from a competing explanation. Here, the combination of structure, environment and measured response provides that test. The conclusion remains open to refinement without making the core evidence arbitrary.
Symmetry does not mean perfect identity
The six arms of one crystal experience nearly the same changing environment because they are close together. They often respond similarly, producing approximate symmetry. Tiny differences, collisions and turbulent paths break perfect correspondence. Real snow crystals display defects as well as remarkable order.
In the context of symmetry does not mean perfect identity, this evidence matters because it links an observable feature to a process that can be tested independently. A useful explanation also makes a prediction: changing the relevant condition should change the outcome in a specific direction.
For readers evaluating symmetry does not mean perfect identity, the best question is not merely whether the claim sounds plausible, but what observation would distinguish it from a competing explanation. Here, the combination of structure, environment and measured response provides that test. The conclusion remains open to refinement without making the core evidence arbitrary.
Temperature changes crystal habit
Laboratory growth diagrams show that modest temperature differences favour plates, columns, needles or more complex forms. The relation is not a simple colder-means-more-branches rule. Molecular attachment rates differ between the basal and prism faces of ice, and those rates change with temperature.
In the context of temperature changes crystal habit, the important qualification is that one pattern can have several contributing causes, so context and scale must be recorded. Natural variation is informative rather than inconvenient, because limits and exceptions reveal which part of the mechanism is essential.
For readers evaluating temperature changes crystal habit, the best question is not merely whether the claim sounds plausible, but what observation would distinguish it from a competing explanation. Here, the combination of structure, environment and measured response provides that test. The conclusion remains open to refinement without making the core evidence arbitrary.
Humidity controls growth speed and branching
Supersaturation describes how much water vapour is available beyond equilibrium. Higher supersaturation can drive faster growth and morphological instability, helping corners extend into branches. Lower values often favour compact plates or columns. Temperature and supersaturation act together.
In the context of humidity controls growth speed and branching, researchers therefore compare multiple lines of evidence rather than treating one striking example as the whole story. The chronology matters. Similar-looking endpoints can arise by different routes, and only dated or time-resolved evidence can separate them.
For readers evaluating humidity controls growth speed and branching, the best question is not merely whether the claim sounds plausible, but what observation would distinguish it from a competing explanation. Here, the combination of structure, environment and measured response provides that test. The conclusion remains open to refinement without making the core evidence arbitrary.
Branching amplifies small differences
A protruding corner reaches slightly farther into moist air and can collect vapour faster than a recessed region. The protrusion then grows even farther, an instability that produces dendrites. Side branches can repeat the same process, generating elaborate fernlike patterns without a central designer.
In the context of branching amplifies small differences, seen this way, the feature is not an isolated curiosity but the outcome of physical and biological constraints acting together. Measurements are strongest when sampling, calibration and uncertainty are reported, allowing another team to check the inference.
For readers evaluating branching amplifies small differences, the best question is not merely whether the claim sounds plausible, but what observation would distinguish it from a competing explanation. Here, the combination of structure, environment and measured response provides that test. The conclusion remains open to refinement without making the core evidence arbitrary.
The path through a cloud is a history
A crystal falls, rises in an updraft and crosses layers with different temperature and humidity. Its growth mode can change repeatedly. A capped column or plate with sectorlike branches may preserve this environmental sequence, although researchers cannot reconstruct every moment from shape alone.
In the context of the path through a cloud is a history, this evidence matters because it links an observable feature to a process that can be tested independently. A useful explanation also makes a prediction: changing the relevant condition should change the outcome in a specific direction.
For readers evaluating the path through a cloud is a history, the best question is not merely whether the claim sounds plausible, but what observation would distinguish it from a competing explanation. Here, the combination of structure, environment and measured response provides that test. The conclusion remains open to refinement without making the core evidence arbitrary.
Riming makes graupel
Supercooled droplets can freeze on contact with a falling crystal. Light riming decorates its edges; heavy riming obscures the original form and can produce rounded graupel pellets. Graupel is different from hail, which typically grows in strong thunderstorm updrafts through repeated wet or dry accretion.
In the context of riming makes graupel, the important qualification is that one pattern can have several contributing causes, so context and scale must be recorded. Natural variation is informative rather than inconvenient, because limits and exceptions reveal which part of the mechanism is essential.
For readers evaluating riming makes graupel, the best question is not merely whether the claim sounds plausible, but what observation would distinguish it from a competing explanation. Here, the combination of structure, environment and measured response provides that test. The conclusion remains open to refinement without making the core evidence arbitrary.
Crystals can collide and aggregate
Falling crystals collide more readily near temperatures where surfaces become slightly sticky. Aggregates create the large flakes visible during mild snowfalls. A single star-shaped crystal may be only millimetres wide, while an aggregate can be much larger and irregular.
In the context of crystals can collide and aggregate, researchers therefore compare multiple lines of evidence rather than treating one striking example as the whole story. The chronology matters. Similar-looking endpoints can arise by different routes, and only dated or time-resolved evidence can separate them.
For readers evaluating crystals can collide and aggregate, the best question is not merely whether the claim sounds plausible, but what observation would distinguish it from a competing explanation. Here, the combination of structure, environment and measured response provides that test. The conclusion remains open to refinement without making the core evidence arbitrary.
Are any two snowflakes identical?
The number of possible growth histories and microscopic arrangements is enormous, so complex natural crystals are extraordinarily unlikely to match in every detail. Simple laboratory crystals can look nearly identical at ordinary resolution. The popular claim is best treated as a statement about probability and measurement, not a mathematical impossibility.
In the context of are any two snowflakes identical?, seen this way, the feature is not an isolated curiosity but the outcome of physical and biological constraints acting together. Measurements are strongest when sampling, calibration and uncertainty are reported, allowing another team to check the inference.
For readers evaluating are any two snowflakes identical?, the best question is not merely whether the claim sounds plausible, but what observation would distinguish it from a competing explanation. Here, the combination of structure, environment and measured response provides that test. The conclusion remains open to refinement without making the core evidence arbitrary.
Why snow looks white
Clear ice crystals have many air–ice boundaries and orientations. Light is repeatedly reflected and scattered across visible wavelengths, so a snowbank appears white. Deep snow can look blue where longer paths absorb more red light, while dirt or algae can change the colour.
In the context of why snow looks white, this evidence matters because it links an observable feature to a process that can be tested independently. A useful explanation also makes a prediction: changing the relevant condition should change the outcome in a specific direction.
For readers evaluating why snow looks white, the best question is not merely whether the claim sounds plausible, but what observation would distinguish it from a competing explanation. Here, the combination of structure, environment and measured response provides that test. The conclusion remains open to refinement without making the core evidence arbitrary.
How scientists photograph and classify snow
Researchers capture crystals on cold surfaces, use microscopes and high-speed cameras, and record temperature, humidity and airflow. Classification systems name plates, stellar dendrites, columns, needles, aggregates and rimed forms. Categories help comparison, but nature produces continuous variation and hybrids.
In the context of how scientists photograph and classify snow, the important qualification is that one pattern can have several contributing causes, so context and scale must be recorded. Natural variation is informative rather than inconvenient, because limits and exceptions reveal which part of the mechanism is essential.
For readers evaluating how scientists photograph and classify snow, the best question is not merely whether the claim sounds plausible, but what observation would distinguish it from a competing explanation. Here, the combination of structure, environment and measured response provides that test. The conclusion remains open to refinement without making the core evidence arbitrary.
How to evaluate new claims about how do snowflakes form
New discoveries about how do snowflakes form are often announced with a dramatic headline, but the durable question is whether the new result changes the mechanism described above. Check what was actually measured, how large and representative the sample was, whether the work passed expert review, and whether the uncertainty is visible. A result can be interesting without overturning everything previously known. Replication, improved instruments and a better chronological or environmental record usually strengthen knowledge by degrees.
For how do snowflakes form, source type matters as well. A research paper reports methods and results, an institution may provide accessible context, and a news story interprets the work for a broad audience. These roles are useful but not interchangeable. Barnakle links to the most authoritative available records so readers can follow the evidence beyond the summary. When later measurements disagree, the responsible response is to examine methods and scope—not to choose whichever claim sounds more surprising.
Frequently asked questions
What is the simplest accurate explanation?
In brief: A snow crystal begins when water vapour deposits as ice around a tiny particle in a cold cloud. The hexagonal arrangement of water molecules guides sixfold symmetry, while temperature and humidity along the crystal’s path control whether it grows plates, columns, needles or branching stars.
Is there one cause?
Usually not. For how do snowflakes form, the central mechanism operates within a system whose history, environment and geometry affect the result. A good explanation names the dominant cause without pretending that secondary influences disappear.
How do scientists know?
Researchers studying how do snowflakes form combine observation with measurements that test specific predictions. Independent methods have different sources of error, so agreement among them is more persuasive than repetition of the same method.
Can photographs be misleading?
A photograph related to how do snowflakes form records a particular place, time, scale and processing choice. It can document real evidence while still omitting motion, depth, invisible wavelengths or surrounding conditions. Captions and source records provide essential context.
What remains uncertain?
For how do snowflakes form, fine details, boundary cases and historical reconstruction remain active research areas. Uncertainty is not equivalent to ignorance: well-supported mechanisms can coexist with unanswered questions about timing, variation or relative importance.
Key takeaways
- A snow crystal begins when water vapour deposits as ice around a tiny particle in a cold cloud. The hexagonal arrangement of water molecules guides sixfold symmetry, while temperature and humidity along the crystal’s path control whether it grows plates, columns, needles or branching stars.
- The mechanism is supported by multiple forms of evidence rather than appearance alone.
- Variation and exceptions help researchers test where simplified explanations stop working.
- Source quality, scale and uncertainty should travel with every scientific claim.
Continue exploring
What researchers will test next
Progress now depends on measurements that connect controlled experiments with the complexity of the wider world. Researchers need observations collected across different locations, instruments and timescales, with methods described clearly enough for independent teams to repeat them. Larger samples can reveal whether an apparent pattern is widespread or driven by a few unusual cases. Longer records can separate temporary variation from a durable change.
New instruments may improve precision, but precision alone does not guarantee a better explanation. Scientists must still test alternative causes, disclose uncertainty and check whether an analysis gives the same answer when reasonable assumptions change. Open data and carefully documented methods allow other researchers to find errors, reproduce results and combine evidence that was gathered for different purposes.
The most useful future studies will make competing explanations face distinct predictions. When several independent tests agree, confidence can grow. When they disagree, the mismatch becomes evidence about what the original account was missing. Barnakle treats this process as a strength of science: conclusions can be reliable without being final, and responsible reporting should explain both what is known and what observation could change the picture.
Sources and further reading
Keep exploring.
One remarkable idea at a time—nature, science, history and beyond.
Sources and further reading
Barnakle uses credible primary and authoritative sources wherever possible.
- NOAA National Severe Storms Laboratory — Winter weather
- https://www.nssl.noaa.gov/education/svrwx101/winter/
- UCAR Center for Science Education — Snowflakes
- https://scied.ucar.edu/learning-zone/storms/snowflakes
- American Meteorological Society Glossary — Snow crystal
- https://glossary.ametsoc.org/wiki/Snow_crystal
- Caltech SnowCrystals — Kenneth Libbrecht
- https://www.its.caltech.edu/~atomic/snowcrystals/
- NOAA — How snow forms
- https://www.noaa.gov/jetstream/snow
Last reviewed October 1, 2026.

Barnakle Editorial Team
A member of the Barnakle editorial team, exploring remarkable ideas with clarity, curiosity and care.
More from this author →