
Radio echoes reveal distance, precipitation and radial motion
A weather app can show a bright patch of rain while the street outside remains dry. That is not automatically a contradiction. Radar samples a volume of atmosphere, often well above the ground, and software translates those measurements into a map.
To read that map sensibly, separate three questions: where did the signal return from, how strong was the return, and how were the targets moving? Modern systems add further measurements, but those three are the foundation.
Follow the mechanism
- An antenna sends a short pulse of radio energy.
- Particles scatter energy, with a small fraction returning to the receiver.
- Timing and successive echoes reveal range and radial motion.
- Processing turns the measurements into mapped weather products.
Radar supplies its own illumination
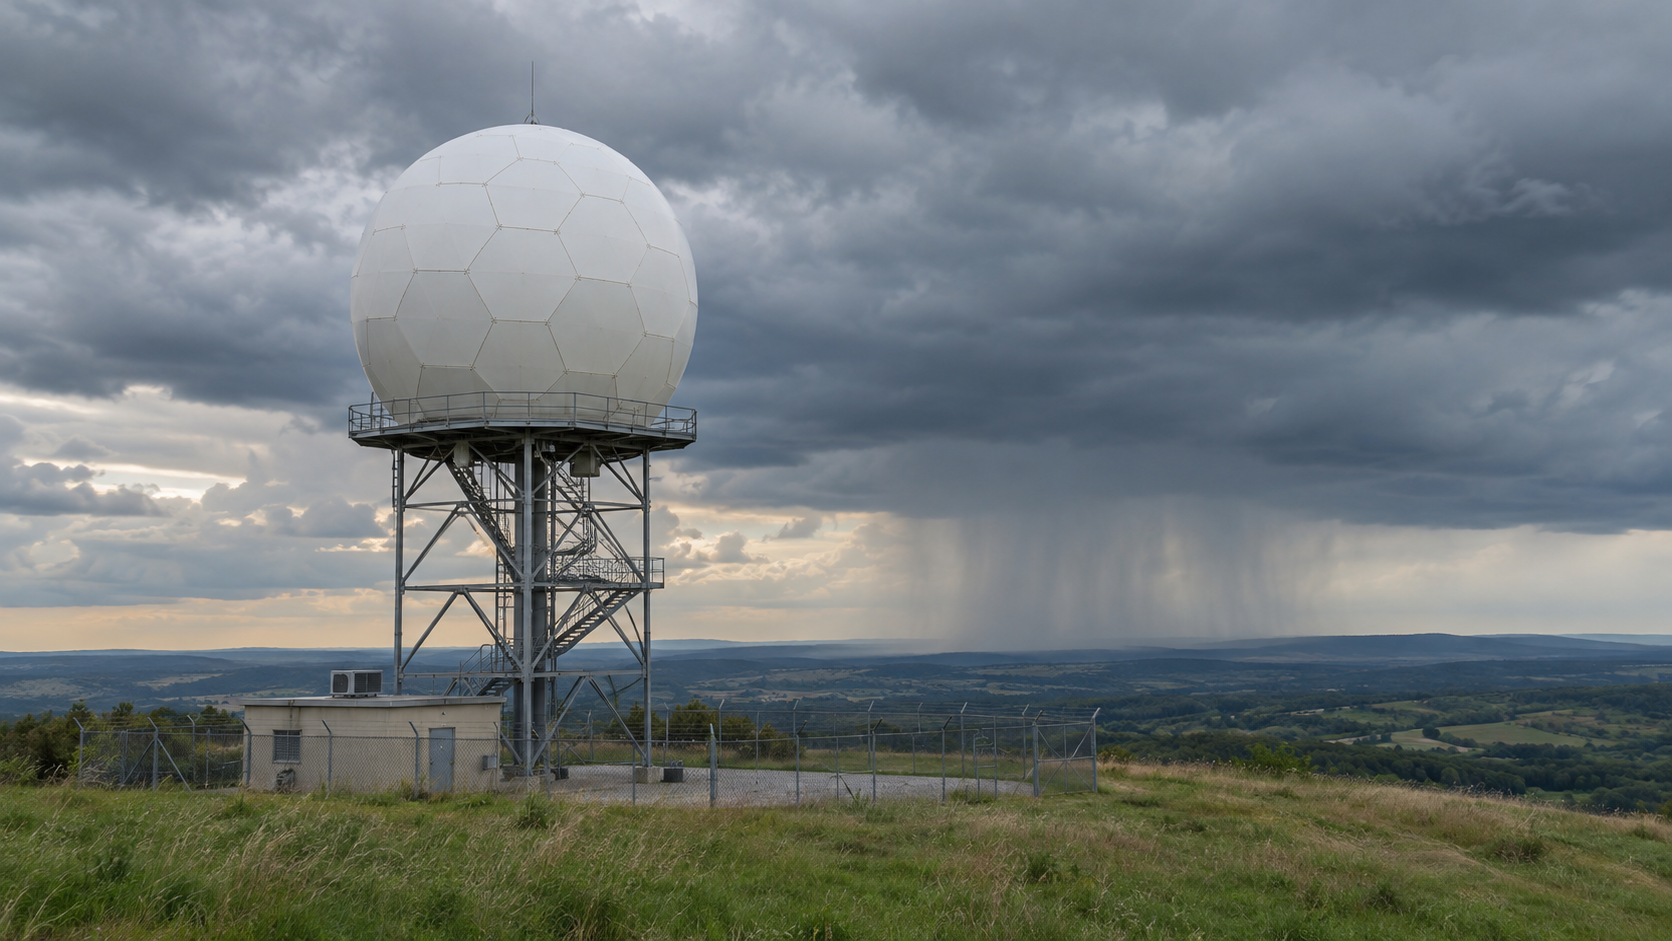
Weather radar is an active sensing system. It transmits energy and listens for returns, rather than waiting for sunlight reflected into a camera. NOAA’s WSR-88D explanation describes short transmitted pulses followed by listening periods.
Only a small fraction of the scattered energy comes back toward the radar. The receiver and processing system must extract useful information from those returns. The resulting image is therefore built from measurements, not captured as an ordinary landscape photograph.
The analogy with an echo is helpful as long as the wave type stays clear. A shout and a radar pulse can both return information after interacting with something at a distance, but radar uses electromagnetic waves, not sound travelling through air.
The return time gives distance, with a factor of two
A pulse has to travel outward and then back. If the measured round-trip time is t, the target range is approximately c × t ÷ 2, where c is the speed of light in the propagation medium.
For an illustrative calculation, use 300,000,000 metres per second and a round-trip time of 0.0004 seconds. The total travel distance is 120,000 metres. Dividing by two places the scattering region about 60 kilometres from the radar. These are teaching values, not an interpretation of a live scan.
Forgetting the return journey would double the inferred range. Knowing where the antenna was pointing supplies the other part of the location information. Together, direction and timing let the system place measurements in space.
Sources: [1]
Reflectivity measures an echo, not a bucket of rain
Reflectivity describes returned energy associated with the targets in the sampled region. In a precipitation display, a stronger return often corresponds to more intense precipitation, but the relationship also depends on the particles involved.
A region of hail and a region of rain need not produce the same return for the same liquid-water equivalent. Interpreting an echo as a precise rainfall rate therefore requires assumptions and processing, rather than simply assigning a colour to “how wet the ground is”.
The map legend matters. Cloud particles and precipitation also belong to different parts of the atmospheric story. A reflectivity product, a rainfall-accumulation estimate and a velocity product represent different quantities. Before interpreting a bright colour, identify the variable and its units. The same display colour can mean different things in different products.
| Part or idea | What it does | Common misunderstanding |
|---|---|---|
| Echo delay | How far away the scattering region is. | Distance is based on a one-way journey. |
| Reflectivity | How strong the returned signal is. | A colour gives an exact ground rainfall rate. |
| Doppler velocity | Motion toward or away from the radar. | One radar directly measures every direction of wind. |
| Dual polarization | Differences between horizontal and vertical signal properties. | It is a separate photograph of each raindrop. |
Doppler radar measures motion along the line of sight
Movement affects the phase of successive returned pulses. Doppler processing uses those changes to estimate the targets’ velocity toward or away from the radar. This is radial velocity: motion along the viewing direction.
Imagine a target moving around a circle centred on the radar at a steady distance. Its speed can be substantial while its radial velocity is near zero, because it is neither approaching nor receding. This geometric thought experiment explains why “zero radial velocity” does not necessarily mean still air.
NCAR and the National Weather Service describe how Doppler measurements add motion information to an echo map. Interpreting a wind field requires attention to the radar location and the measurement geometry. One colour patch alone does not supply every component of a three-dimensional wind vector.
Dual polarization adds information about the targets
Dual-polarization weather radar measures horizontal and vertical signal properties. Comparing them gives information related to the shapes, orientations and mixture of targets within a sampled volume.
NOAA explains, for example, how differential reflectivity compares the horizontal and vertical returns. Environment and Climate Change Canada describes how the additional information helps distinguish precipitation types and improve precipitation estimates.
These are inferences from a group of scattering particles. A map pixel is not an enlarged picture of one snowflake or raindrop. The interpretation combines several measurements and their physical relationships, which is why the technology adds evidence rather than removing every ambiguity.
Why distant radar measurements can miss low weather
A radar beam spreads with distance, so a distant sampled volume is broader than a nearby one. The lowest scan also generally rises higher above the ground as range increases, because of the viewing geometry and Earth’s curvature, with atmospheric refraction affecting the path.
NOAA’s radar-beam guide explains that this can hide smaller features and make distant low-level structures difficult to see. Terrain can also obstruct a view. A blank or weak patch on a map is therefore not proof that every layer beneath the sampled volume is precipitation-free.
Think of looking across a room over the top of a low table. Seeing empty space above the tabletop does not inspect the space underneath it. The comparison is only about sampling geometry; a real radar beam is broad, refracted and processed rather than a single straight sightline.
Sources: [7]
Why a return is not always rain
The National Weather Service shows that birds, insects and other non-precipitation targets can return energy. It also describes anomalous propagation, where atmospheric conditions bend the beam so that it encounters ground targets differently from expected.
Quality-control processing attempts to distinguish useful weather echoes from other signals. Dual-polarization information can help, but a radar product still needs interpretation. A visually striking pattern is evidence of a return, not an automatic identification of its cause.
The distinction is useful beyond weather. Scientific instruments record signals; an explanation connects those signals to a physical source. Keeping the two steps separate makes it easier to understand both the strength of a measurement and the reasons it can be misleading.
A practical order for reading a radar map
Start with the product name, legend and timestamp. Then locate the radar if the product is from one site, and look at the sequence of recent observations rather than treating one frame as a complete account.
Ask what is actually measured: returned strength, radial velocity or a processed estimate of precipitation. Check whether the displayed layer samples the altitude and location relevant to your question. Those checks are a reading method, not a way to diagnose a storm from one screenshot.
For weather decisions, read the official forecast and warnings alongside the radar display. A radar image is one source of evidence within the observing and forecasting system, rather than a complete statement of current or future conditions at every address.
Questions readers ask
Does radar see clouds or rain?
It detects scattering targets within its sensitivity and sampling limits. Many familiar weather-radar products focus on precipitation-sized particles, rather than providing a photograph of every visible cloud.
Does red always mean heavy rain?
Read the legend. On reflectivity and velocity maps, colours represent different variables. A velocity colour usually describes radial motion, not rainfall intensity.
Does Doppler radar measure the whole wind?
A single Doppler measurement describes the component toward or away from the radar. Further interpretation is needed to infer the wider flow.
Why can a map show rain when the ground is dry?
The radar may be sampling precipitation above the surface, at a different time, or within a product affected by other returns and processing. The image alone does not identify one explanation for every case.
Is dual polarization the same as Doppler?
No. Doppler processing provides radial-motion information. Polarimetric measurements compare signal properties that help interpret the scattering targets.
The colours are the end of a measurement chain
The essential sequence is transmit, scatter, receive, measure and interpret. Echo delay places the target, signal properties describe its return, and repeated pulses reveal motion. Additional processing builds products useful to forecasters and the public.
The most useful habit is to ask what each product actually measures. That turns a colourful image into a more understandable view of the atmosphere, with a clear sense of the places and motions it can sample.
Continue exploring
Sources and further reading
Keep exploring.
One remarkable idea at a time—nature, science, history and beyond.
Last updated November 6, 2026.

Barnakle Editorial Team
Barnakle Editorial Team is the collective byline used for Barnakle’s editorial articles. The contributor profile explains the team identity and links to the publication’s editorial policies.
More from the editorial team →