
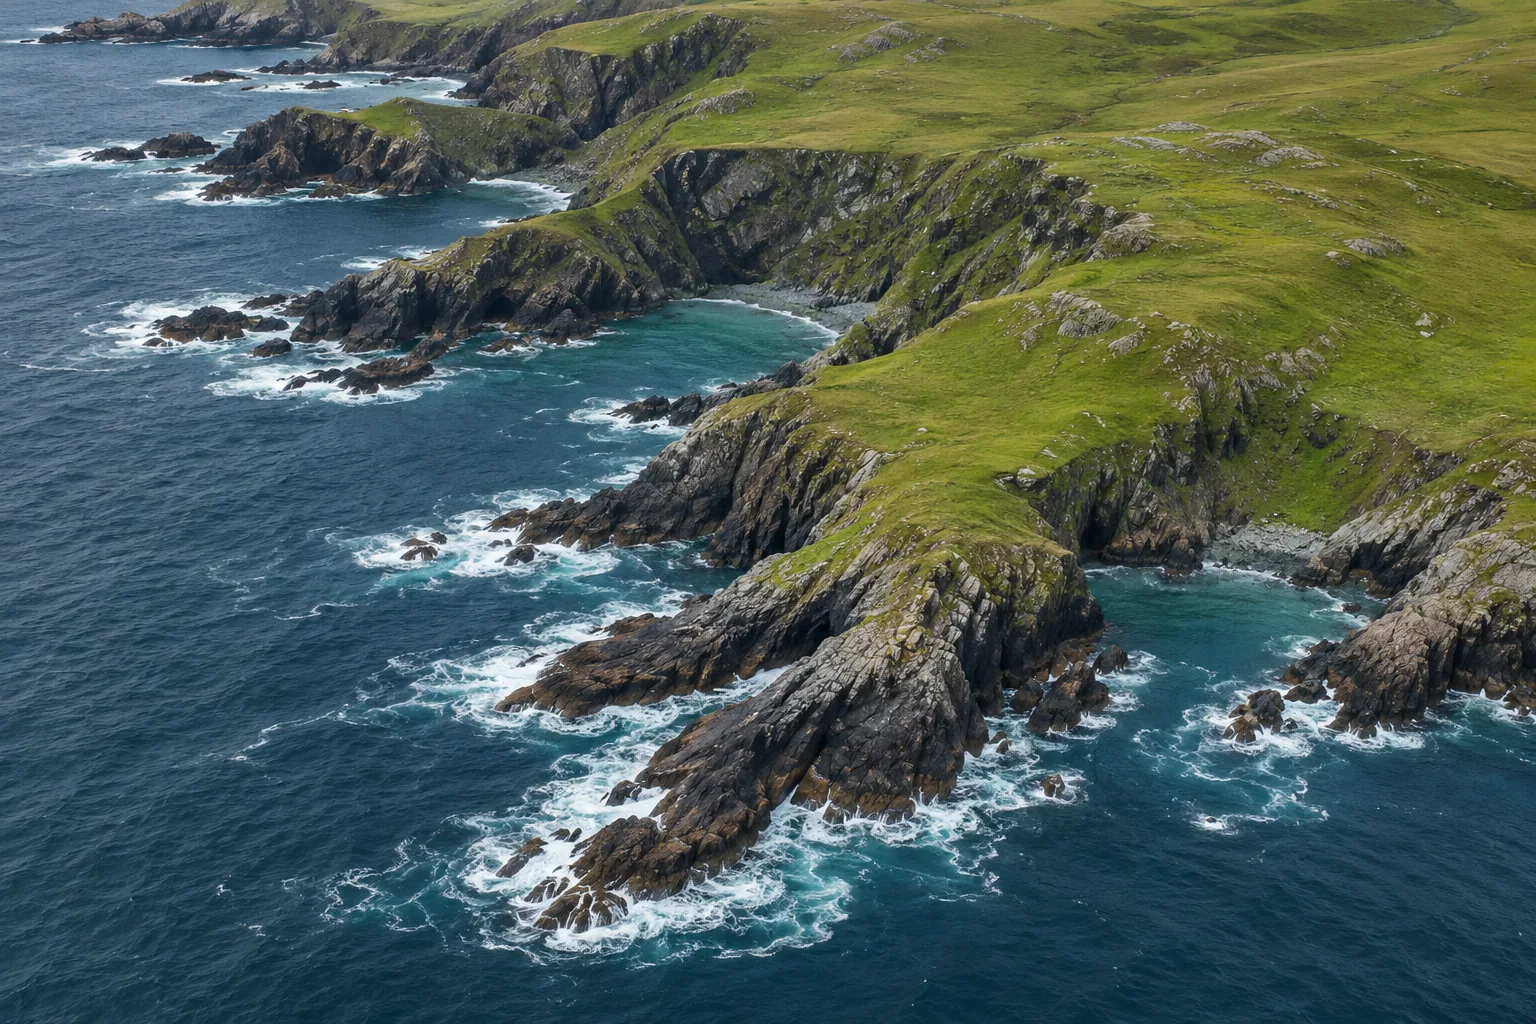
Draw a line between two rocky headlands and you can measure their separation with a ruler. Now try to measure the shore between them. The pencil has to visit the back of the bay, bend around a spit and turn again where a creek meets the sea. A map that leaves out the creek gives a different answer even if both maps put the two headlands in exactly the right places. That dependence on detail is called the coastline paradox.[1]
The extra length comes from replacing shortcuts with paths that follow the shore more closely. A long measuring step can bridge a small inlet. Several short steps can go inside it. Making that change around hundreds of islands and bays can add up to a substantial difference. Both measurements can be repeatable, and both can be appropriate for the maps from which they were taken.[1, 2]
Where the extra metres come from
Picture a deliberately simple stretch of coast. Two points at the entrance of a triangular cove are 80 metres apart. The cove reaches 30 metres inland at its midpoint. A line drawn straight across the mouth measures 80 metres. A line that visits the back of the cove first takes two slanting legs. Each is the long side of a right triangle measuring 40 metres along the mouth and 30 metres inland. Each leg is 50 metres, giving a total of 100.
Those extra 20 metres are easy to locate on a drawing. Nothing has happened to the water, nobody has moved the end markers and neither ruler has a faulty scale. One survey represented the cove with a single segment and the other used two. If each side of the cove contained another little indentation, a third survey could add more distance for precisely the same reason.
There is a useful limit to this example. Divide a perfectly straight 80-metre wall into eight sections and the pieces still total 80 metres. Shortening a ruler makes a difference where it reveals a change of direction. The size of the effect depends on the shape of the coast over the range of detail that you can resolve. A convoluted inlet and a straight seawall respond differently to the same mapping method.[1, 2]
What a map can and cannot give back
Imagine two people tracing the same digital shoreline. One clicks at every bend. The other clicks at every fifth bend and lets the software connect the points. Both use kilometres, the same projection and the same two endpoints. The detailed tracing can recover little detours the second person crossed in a straight line. The rule about which points to keep matters as much as the choice of units.
Now give both people a very coarse outline with only five corners. Zooming the file until it fills an entire wall makes those corners larger on the screen. It cannot supply the positions of missing rocks and coves. Adding a thousand points along an existing straight segment merely chops that segment into smaller pieces. To recover a feature omitted at the outset, the surveyors need a source with more spatial detail.
Benoit Mandelbrot used coastlines to explore statistical self-similarity. A small stretch of rough coast can contain a mixture of inlets and projections reminiscent of those visible over a much larger stretch. The little features need not copy the shape of the large ones. What can persist across scales is the way that additional detail changes a measurement. The behaviour of an ideal mathematical curve can be examined indefinitely. A shoreline file has an identifiable scale and a finite set of coordinates.[2]
Which line counts as the shore?
Even surveyors working at identical resolution can trace different boundaries. One aerial photograph catches the tide far out on a sand flat. A second shows the same flat covered in water. A steep cliff might show little horizontal change between the two images, while the water’s edge on gently sloping sand could move a considerable distance. The time of the photograph is a different issue from the size of its pixels.
A mapped shoreline can be tied to a reference water level. For example, NOAA lists mean high water as the tidal reference for its shoreline data extracted from nautical charts. That definition makes it possible to describe the intended boundary independently of the instant someone happens to walk past. The product also records its source chart scales. The tidal reference and the source scale answer two separate questions about the line.[4]
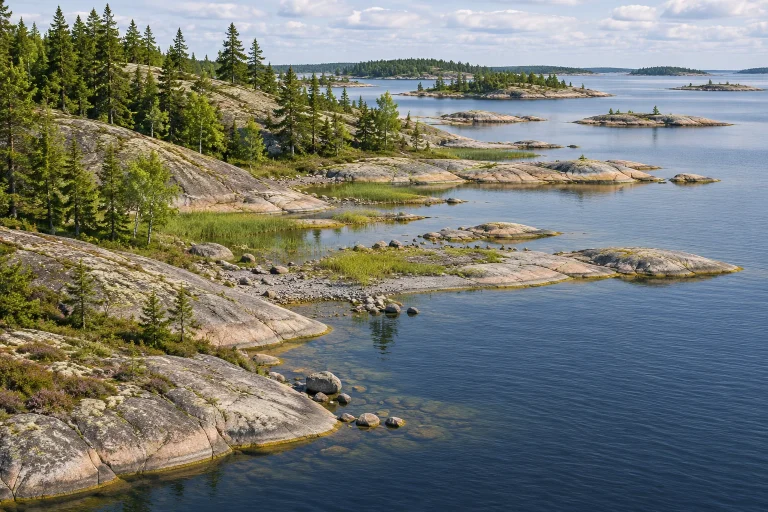
A river mouth raises another choice. Should the survey cross from one headland to the other, trace both banks into the estuary or stop where the channel narrows to a stated width? Every added kilometre upstream can contribute a stretch of shoreline on each bank. The same issue arises with islands. Including the island shorelines adds their perimeters even when the position of the mainland shore is unchanged.[3]
What a published coastline figure means
NOAA’s published U.S. shoreline figure is 95,471 miles. Its explanation matters as much as the number. The historical measurements included offshore islands and coastal indentations, followed tidal waterways to specified limits, and incorporated a later set of Great Lakes measurements. It is a total for a defined collection of shores assembled by a particular method. Someone tracing only the outer mainland edge would be answering a different question.[3]
Consider a claim that a coast has gained ten kilometres since the last survey. Before looking for newly deposited sand, compare the datasets. Did both include the islands? Did one use a large-scale harbour chart where the other used a national outline? Were the endpoints and tidal reference the same? The clearest test is often to compare an unchanged reach at a common resolution, then inspect the reaches where the lines still diverge.
For a reader comparing two maps, the triangular cove offers a quick visual test. Pick one small bay that appears on both maps. Follow the line with a fingertip and watch where it crosses water to reach the opposite side. The first shortcut you find is a piece of the numerical difference you can actually see. Once the boundary, scale and inclusion rules are stated, the length becomes a measurement another person can reproduce.
Keep exploring
Two physical processes also change the boundary a mapmaker sees. Follow the rise and fall of the tide and the deposition of sediment at a river mouth.
Sources and further reading
- Wolfram MathWorld — Coastline Paradox
- Benoit Mandelbrot — How Long Is the Coast of Britain?
- NOAA National Ocean Service — How long is the U.S. shoreline?
- NOAA Shoreline — Shoreline extracted from nautical charts
Keep exploring.
One remarkable idea at a time—nature, science, history and beyond.
Last updated November 19, 2026.

Barnakle Editorial Team
Barnakle Editorial Team is the collective byline used for Barnakle’s editorial articles. The contributor profile explains the team identity and links to the publication’s editorial policies.
More from the editorial team →