
Reading alien air one wavelength at a time
What to know
- Spectra measure wavelength-dependent light, not photographs of gases.
- Transit, eclipse, phase-curve and direct-imaging methods answer different questions.
- Clouds and stellar spots can imitate or hide molecular features.
- Detecting one molecule is not the same as detecting life.
A planet can disappear into the glare of its star and still leave a chemical trace. When the planet crosses the star, a thin ring of starlight passes through its atmosphere. At particular wavelengths, atoms and molecules absorb part of that light. The resulting spectrum is not a photograph of alien air. It is a measurement of how the combined star-and-planet system changes with wavelength and time.
Recovering that signal is among astronomy’s most delicate forms of remote sensing. The atmospheric contribution may be only tens or hundreds of parts per million. Detectors, telescope pointing, stellar spots, clouds and data-processing choices can all affect a result. Scientists therefore combine repeated observations, calibration, physical models and competing interpretations before turning a dip in a spectrum into a claim about water, carbon dioxide or another gas.
Start with the planet’s orbit
Atmospheric work usually begins after astronomers know a planet’s orbital period and approximate size or mass. The transit method measures the fraction of starlight blocked when a planet passes in front of its star. A deeper transit generally indicates a larger planet relative to the star. Radial-velocity observations can estimate mass by tracking the star’s motion toward and away from us. Size and mass together yield bulk density, an essential clue to whether a world is rocky, gas rich or somewhere between.
Those measurements set the context for an atmosphere. A low-density giant and a compact rocky world can produce very different spectra even at similar temperatures. Surface gravity controls atmospheric scale height: lower gravity and higher temperature generally make an atmosphere more extended and its spectral features easier to detect.
Transmission spectroscopy
During a transit, the planet blocks an opaque disk plus a wavelength-dependent amount of light filtered through the atmosphere. If water vapor absorbs infrared light in a particular band, the planet appears slightly larger there. Astronomers compare the in-transit spectrum with the out-of-transit spectrum to construct a transmission spectrum.
The method samples the atmosphere near the planet’s limb, where starlight follows a long slanting path. That geometry increases sensitivity but complicates interpretation. Morning and evening sides can have different temperatures, chemistry and clouds. Refraction and hazes may block access to deeper layers. A nearly flat spectrum might indicate a compact atmosphere, high clouds, haze or simply limited measurement precision.
Secondary eclipses and planetary emission
When a planet passes behind its star, the combined system temporarily loses the planet’s light. Subtracting the in-eclipse signal from the signal immediately before or after the eclipse can isolate the planet’s dayside contribution. At infrared wavelengths, that contribution includes thermal emission; at shorter wavelengths it may include reflected starlight.
An emission spectrum can constrain dayside temperature and molecular absorption or emission. A temperature inversion—an upper atmosphere warmer than layers below—can reverse the direction of some spectral features. Interpreting such spectra requires radiative-transfer models that follow how light is absorbed, emitted and scattered through layers with different temperatures and compositions.
Phase curves map changing light
A planet presents different longitudes as it moves around its star. Measuring brightness through an orbit produces a phase curve. Its maximum, minimum and timing reveal how efficiently winds redistribute heat from day to night. If the brightest point occurs before or after secondary eclipse, the offset can indicate eastward or westward movement of a hot region.
Phase curves do not produce detailed weather maps. Researchers infer broad longitudinal patterns from an integrated signal. Clouds can change reflectivity, while temperature changes affect infrared emission. Multiwavelength observations help separate those effects, but the inversion from light curve to atmospheric map remains model dependent.
Direct imaging
Direct imaging suppresses the star’s overwhelming light with a coronagraph or related optical technique, then searches for a much fainter companion. It works most readily for young, hot giant planets orbiting far from their stars. The angular separation helps instruments distinguish the planet, and youth makes the planet glow strongly in infrared light.
A directly imaged spectrum can reveal clouds, temperatures and molecules without waiting for a transit. The method also opens access to systems whose orbital alignment never produces eclipses. Future extremely large telescopes and space observatories aim to push this approach toward smaller, cooler worlds, but contrast and wavefront stability are formidable challenges.
Why molecules leave patterns
Molecules rotate and vibrate in quantized ways, absorbing and emitting characteristic ranges of infrared light. Atoms produce their own spectral lines. A real atmospheric spectrum contains overlapping bands whose shapes depend on temperature, pressure, abundance and clouds. Researchers use laboratory measurements and quantum calculations to build opacity databases describing these interactions.
No molecule is identified responsibly from a single isolated bump. Analysts examine a pattern across wavelengths and test whether alternative molecules or systematics could explain it. Spectral resolution, wavelength coverage and signal quality determine how confidently individual contributors can be separated.
Atmospheric retrieval
A retrieval algorithm compares observed data with many possible atmospheres. It varies parameters such as temperature structure, molecular abundance, cloud pressure and reference radius, then estimates which combinations are compatible with the spectrum. Bayesian methods are commonly used because they describe probability distributions and trade-offs rather than returning one deceptively exact answer.
Different combinations can produce similar spectra. More cloud can hide absorption; a changed reference radius can alter inferred abundance; an assumed temperature profile can shift chemistry. Researchers test alternative model families and report credible intervals. A retrieval is best understood as conditional: given these data, assumptions and model ingredients, these atmospheric states are favored.
Stellar contamination
The star is not a uniform lamp. Cool spots, hot faculae and changing magnetic activity alter its spectrum. If a planet crosses one region while the unocculted star has a different mix, the apparent transit depth can change with wavelength in a way that resembles a planetary feature. This is especially important for small planets around active red dwarfs.
Teams monitor stars over time, analyze spectral activity indicators and model heterogeneous surfaces. Observations of multiple transits can expose variability. Stellar contamination cannot always be removed perfectly, so strong planetary claims must show that plausible stellar models do not provide an easier explanation.
Clouds, haze and chemistry
Cloud particles can mute molecular bands by blocking long atmospheric paths. Photochemical haze can scatter short-wavelength light and create slopes. Condensation depends on temperature, pressure and available elements, while ultraviolet radiation drives chemistry far from equilibrium. Vertical mixing can carry molecules between layers faster than reactions restore equilibrium.
These processes make clouds scientifically useful rather than merely obstructive. Their altitude and composition reveal circulation and chemistry. Yet cloud models contain uncertain particle sizes and distributions. Broad wavelength coverage is valuable because clouds, gas absorption and stellar effects leave different signatures across the spectrum.
What Webb changed
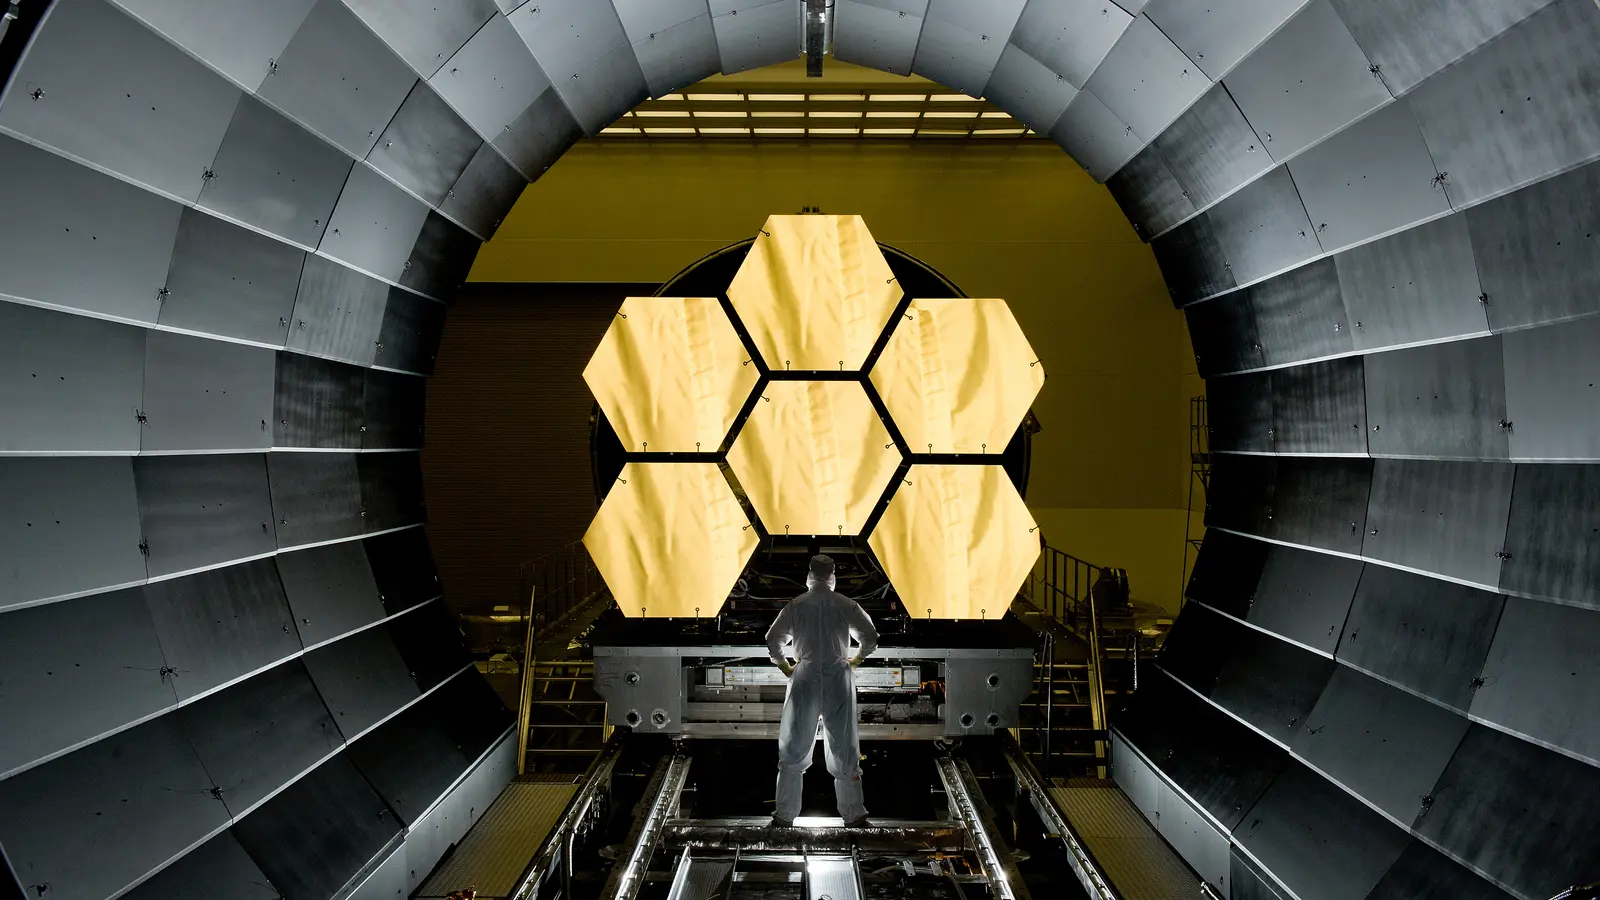
The James Webb Space Telescope brought stable, sensitive infrared spectroscopy across wavelength ranges rich in molecular features. Early observations demonstrated carbon dioxide in a hot giant atmosphere and produced detailed spectra for a growing variety of worlds. Webb’s instruments use several observing modes, and overlapping measurements can test consistency.
Webb does not make every target easy. Small rocky planets create much weaker signals, and their host stars can be active. Time is limited, so programs must choose targets and repeat visits carefully. The telescope’s greatest contribution may be comparative: measuring enough planets to ask how atmosphere changes with size, temperature, composition and stellar environment.
From a gas to a climate
A list of molecules is not a climate. To understand a planet, researchers consider energy arriving from the star, reflectivity, greenhouse absorption, circulation, clouds, interior heat and possible atmospheric loss. The same molecule can arise through different pathways. Carbon dioxide, for example, is common in planetary atmospheres and is not by itself a sign of biology.
Combining spectra with mass, radius, orbit and stellar ultraviolet output constrains a coherent scenario. Models predict not only composition but also temperature and observable behavior. A useful interpretation explains several features at once and survives comparison with alternative assumptions.
The biosignature problem
A biosignature is not simply a molecule associated with life on Earth. Scientists ask whether a gas or combination would be difficult to maintain without biological production in the specific environment being observed. They must evaluate geological sources, photochemistry, ocean interactions, escape to space and measurement error.
Context is therefore the heart of the problem. Oxygen could accumulate abiotically under some conditions. Methane can have geological sources. A more persuasive case would involve multiple gases in chemical disequilibrium, a well-characterized star and planet, repeatable spectra and the exclusion of plausible nonliving pathways. Even then, language should reflect degrees of evidence.
Why results change
Atmospheric claims often evolve as additional transits are observed or calibration improves. That is expected when signals are close to instrumental limits. A tentative feature can weaken; a disputed molecule can become clearer; a model that once looked adequate can fail across a wider wavelength range.
Good reporting distinguishes data from interpretation. The data are calibrated changes in light. The interpretation is the atmospheric model that explains them. Showing both layers makes revision understandable rather than presenting each new paper as a reversal.
A future atlas of alien air
New observatories will expand the field beyond individual showpiece planets. ESA’s Ariel mission is designed to survey exoplanet atmospheres systematically. Ground-based extremely large telescopes will use high-resolution spectroscopy to separate planetary lines through their changing Doppler shifts. Proposed space missions aim for direct imaging of potentially temperate rocky worlds.
The long-term goal is comparative planetology: learning why some planets retain thick atmospheres, why others lose them, how clouds and chemistry respond to different stars, and how common familiar planetary pathways really are. Each spectrum is incomplete, but together they can reveal the rules that shape planetary climates across the galaxy.
Sources and further reading
- NASA Webb, Exoplanets
- NASA Exoplanet Exploration
- Seager & Deming (2010), Exoplanet atmospheres
- Madhusudhan (2019), Exoplanetary atmospheres
- NASA Webb spectrum of WASP-96 b
- ESA Ariel mission
How Barnakle selects and verifies sources · Corrections and updates
Keep exploring.
One remarkable idea at a time—nature, science, history and beyond.
Last reviewed September 16, 2026.

Barnakle Editorial Team
A member of the Barnakle editorial team, exploring remarkable ideas with clarity, curiosity and care.
More from this author →