
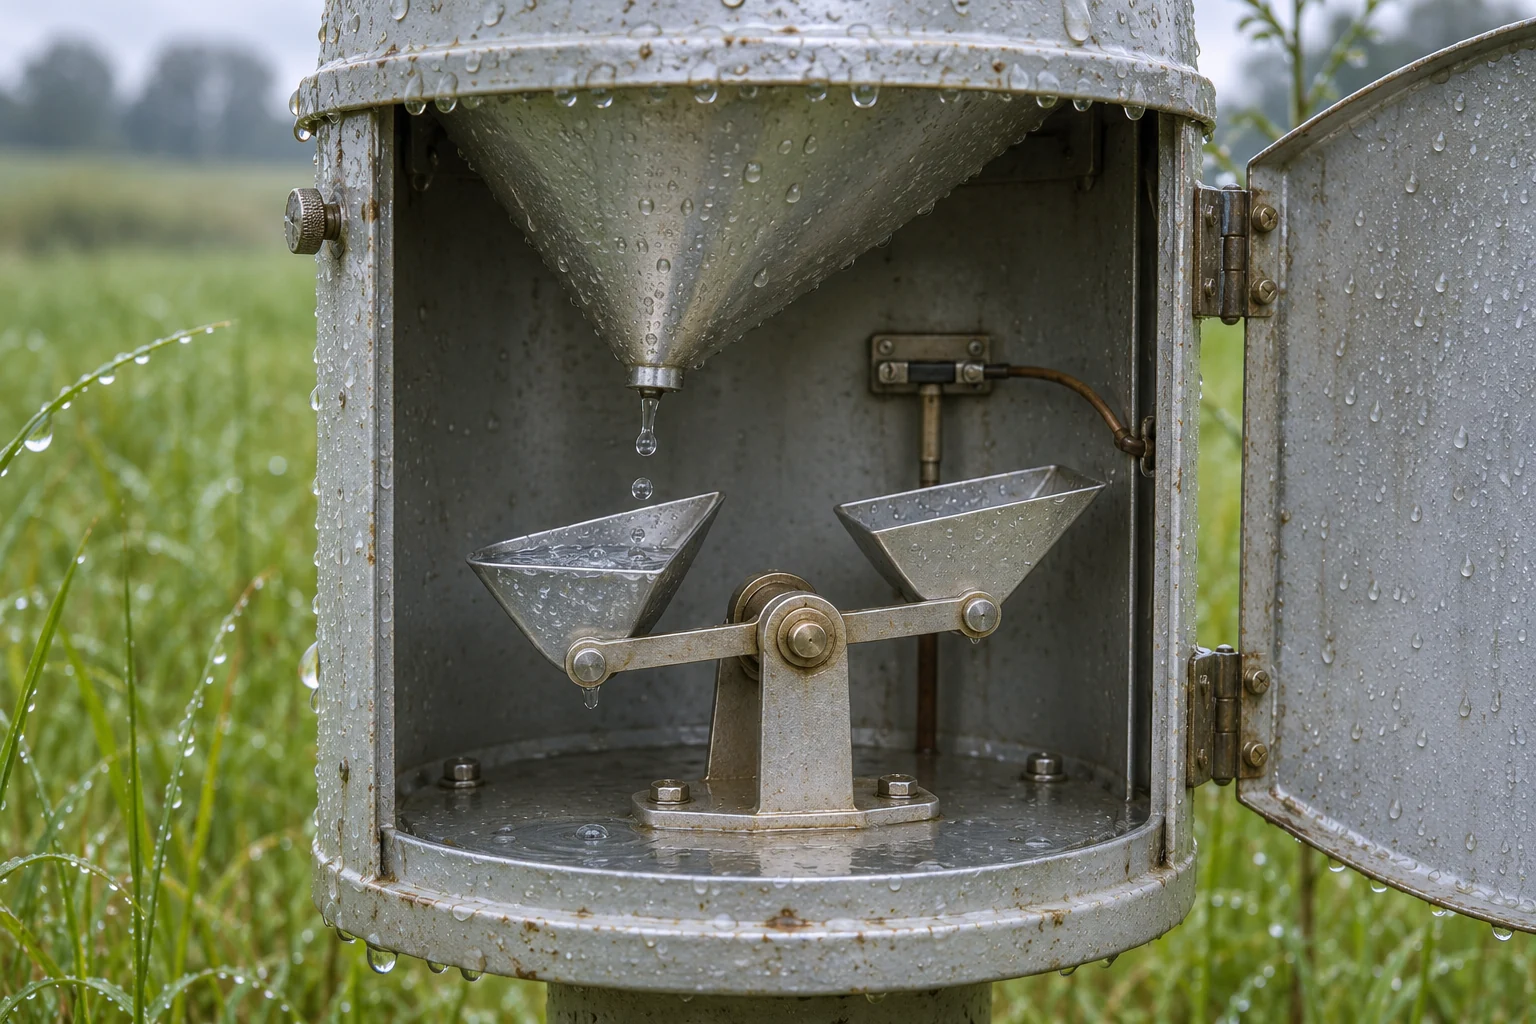
It can rain steadily for ten minutes without an automatic weather station recording a single drop in its rainfall total. Then the total jumps, all at once. Inside a tipping-bucket rain gauge, a little cup has finally gathered enough water to overbalance. Its partner swings into place and starts collecting the next instalment. The machine keeps a tally of these movements. The weather record inherits both the elegance of that arrangement and its peculiar sense of time.[1, 2]
What the station reports is a depth, usually millimetres or inches. This is the depth the collected rain would have made if spread evenly over the horizontal area of the gauge opening. It is not the depth of water sloshing around in the little cup. A broad funnel can concentrate a very shallow layer of rain into enough water to tip a small mechanism. The size of the opening and the amount needed to trigger one tip belong together in the calibration.[1, 4]
What the click means
Under the funnel sit two compartments on opposite sides of a pivot. One is positioned to catch the water. When it fills to the tipping point, its weight shifts the balance and it empties. The movement places the other compartment beneath the outlet. A switch registers a pulse as the mechanism changes position, so the recording equipment can sit well away from the wet part. The next pulse comes from a tip the other way. Both directions add the same nominal increment to the rainfall total.[2, 4]
The UK Met Office describes a design with an opening of 750 square centimetres and a tip for every 0.2 millimetres of rain. Convert that depth to 0.02 centimetres and multiply by the opening area. The result is 15 cubic centimetres, or 15 millilitres, collected per tip. A teaspoon placed out in the same shower would collect far less water because its mouth is smaller. The millimetres of rain falling at the two spots could nevertheless be identical.[1]
How a count becomes a rate
Suppose a gauge scaled at 0.2 millimetres per tip records twelve tips. The indicated total is 2.4 millimetres. If they occur over twelve minutes, the average over that interval is twelve millimetres per hour. Spread the same twelve tips across a whole hour and the average is just 2.4 millimetres per hour. Count alone gives the accumulation. The clock on the recorder supplies the information needed for a rate. Using a different interval changes the question the rate answers.[3, 4]
Now imagine a graph that bins the tips by the minute. One tip in a particular minute becomes twelve millimetres per hour when expressed as an hourly rate. Two tips become twenty-four. A minute with no tip appears dry. During a light, steady shower the plot can therefore resemble a fence with isolated posts. A longer averaging interval usually smooths the fence, but it also smudges the timing of a genuine short burst. Both graphs can be accurate representations of exactly the same switch closures.[2, 4]
Real gauges also differ in their increments. The Oklahoma Mesonet describes a gauge recording one hundredth of an inch per tip, approximately 0.254 millimetres. An analyst given a file of tip times from one of those stations would get the wrong total by using the Met Office instrument’s 0.2-millimetre factor. A table of raw counts needs an instrument description. Even a perfectly synchronized clock offers no protection against using the wrong size of bucket in the calculation.[1, 2]
Where the first drops go
At the start of a shower, water may already be sitting in the upper compartment from an earlier shower. In that case a modest addition can register the first tip almost immediately. Start instead with an empty, dry gauge and that first increment takes longer. The same ambiguity occurs at the end. A little water may remain after the last registered pulse. Some may contribute to a later tip and some may evaporate. The first and last pulses are imperfect markers for the first and last drops outdoors.[2, 3]
At the opposite extreme, the instrument itself takes a finite time to move. In heavy rain, water can continue running into the compartment that has already reached its threshold during part of its swing. More water then passes through the gauge per registered pulse than the nominal amount. Testing at several flow rates can expose this bias. A test that dispenses the right total volume very slowly may miss a problem that appears only in a downpour.[3, 4]
Errors that start above the funnel
Calibration checks the mechanism using water that actually enters it. Wind can change which drops reach the opening in the first place. Airflow bends around an above-ground gauge, altering the paths of approaching drops. Research comparing gauges of different shapes and exposures with a reference gauge at ground level has measured this wind-induced undercatch. A counter that records every swing faithfully may still report less rain than fell on the surrounding patch of ground.[5]
Nor can one perfectly sited gauge describe a whole town during a patchy thunderstorm. One opening samples one place. A station a few streets away may record a genuinely different accumulation, particularly during a short, intense shower. Before interpreting the discrepancy as a faulty gauge, it is worth distinguishing three questions. Did each instrument count correctly? Did it catch a representative sample at its location? Did the same shower actually cross both sites? Those questions require different evidence.[1, 3, 5]
One revealing comparison is to put a station’s cumulative total next to its minute-by-minute graph. During drizzle the total may climb in tidy little steps while the rate jumps up and down. Check the size of a step against the station’s published increment. In a long shower the staircase may keep rising at a remarkably even average slope, although the short-interval plot shows many apparently dry minutes. What looks like erratic weather can turn out to be the signature of a small cup doing exactly what it was designed to do, tipping only when there is enough water to count.[2, 4]
Related reading
Sources
- How we measure rainfall
- Instruments | Mesonet
- Environment Agency — Rainfall measurement and forecasting
- World Meteorological Organization — Measurement of precipitation
- Quantifying and Mitigating Wind-Induced Undercatch in Rainfall Measurements
Keep exploring.
One remarkable idea at a time—nature, science, history and beyond.
Last updated November 22, 2026.

Barnakle Editorial Team
Barnakle Editorial Team is the collective byline used for Barnakle’s editorial articles. The contributor profile explains the team identity and links to the publication’s editorial policies.
More from the editorial team →