
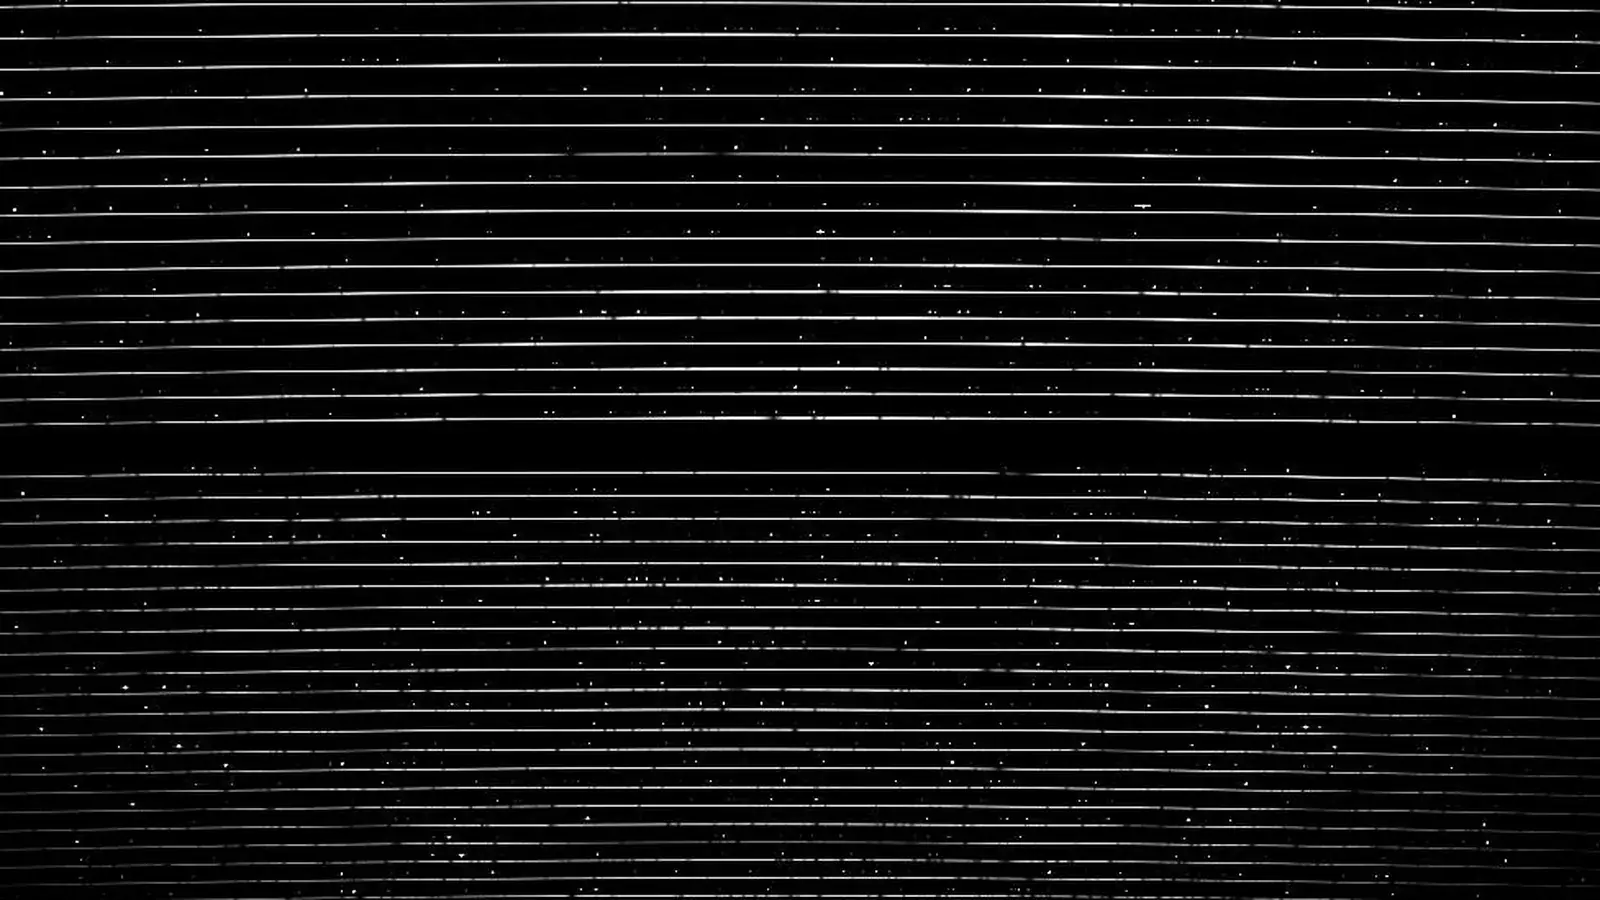
Astronomers do not need to collect a piece of a star to investigate its chemistry. They can spread its light into a spectrum and compare patterns in that light with measurements of atoms and molecules. The result is a form of remote chemical analysis across enormous distances.
The key is not the star's overall colour alone. It is the detailed pattern of bright and dark features at particular wavelengths.
Why atoms leave spectral lines
Electrons in atoms occupy allowed energy states. Absorbing or emitting a photon can move an electron between states when the photon's energy matches the transition. Because elements have different energy-level structures, their collections of transitions form recognisable patterns.
A hot source can supply a broad range of wavelengths. When that light passes through cooler material, selected wavelengths may be absorbed, producing dark lines against the brighter background. Glowing gas can instead produce bright emission features. NASA's spectroscopy explanations distinguish these situations rather than treating every line as the same kind of measurement.
Matching a pattern is stronger than matching a colour
A single apparent feature can be ambiguous. Different transitions may lie close together, and a telescope has finite spectral resolution. Analysts compare multiple lines and laboratory reference data to test an identification.
Think of a melody heard through noise: one note offers little certainty, while several notes in the correct relationship are more informative. This is an analogy for pattern checking, not a claim that a spectrum uniquely identifies every ingredient without modelling.
Strong lines do not always mean abundant elements
Temperature changes which energy states are populated and whether atoms retain their electrons. Density and conditions in the stellar atmosphere also affect how lines form. An element can be present while a particular line is weak, or produce a prominent line without being the star's dominant constituent.
Estimating chemical abundance therefore requires a model of the atmosphere as well as a line identification. This is one reason visual inspection of a colourful spectrum cannot substitute for a quantitative analysis.
Motion adds another layer of information
Relative motion shifts spectral features through the Doppler effect. Rotation and other processes can broaden them. ESA's Gaia spectroscopy overview describes spectra as tools for investigating composition, temperature and motion together.
Those overlapping effects are useful but must be separated carefully. A shifted pattern should not be mistaken for a different set of elements simply because its features moved along the wavelength scale.
What is actually being sampled?
Observed starlight carries information about the regions where it emerged and the material it crossed. It is not a direct inventory of every layer inside the star. Combining spectra with stellar models and other measurements allows astronomers to ask wider questions about stellar history and chemical evolution.
Explore a related question
Sources and further reading
Keep exploring.
One remarkable idea at a time—nature, science, history and beyond.
Last updated October 29, 2026.

Barnakle Editorial Team
Barnakle Editorial Team is the collective byline used for Barnakle’s editorial articles. The contributor profile explains the team identity and links to the publication’s editorial policies.
More from the editorial team →