
The botanical evidence buried beneath archaeological sites
What to know
- Pollen assemblages represent biased pollen rain, not direct plant percentages.
- Stratigraphy and dating turn counts into environmental sequences.
- Agriculture is inferred from multiple indicators, not one cereal-type grain.
- Independent archaeological and ecological evidence tests each reconstruction.
A landscape hidden in grains
Pollen is built to travel, resist damage and deliver the male gametophyte of seed plants. Those same properties make it a durable environmental archive. Lakes, bogs, soils, caves and archaeological deposits can preserve immense numbers of grains. Their shapes and surface patterns often identify a plant family, genus or sometimes species group. By counting pollen through dated layers, researchers reconstruct changing vegetation and infer aspects of climate, land use and disturbance. The method is called palynology. It does not produce a literal photograph of an ancient forest; it builds a probability-rich picture from production, transport, preservation, identification and chronology.
Why pollen survives
The outer wall, or exine, contains sporopollenin, an exceptionally resistant organic material. It protects a grain during transport and can persist after softer tissues decay. Preservation is best where oxygen and microbial activity are limited, such as waterlogged sediments. Heat, oxidation, alkaline conditions and repeated wetting can destroy or distort grains. Archaeological context therefore matters. A sample with little pollen may reflect poor preservation rather than a treeless landscape. Analysts record corrosion, breakage and concentration, and may add known quantities of marker spores so counts can be converted into grains per volume or mass.
Plants produce unequal clouds
A pollen diagram is not a direct percentage map of vegetation. Wind-pollinated trees may release huge quantities of light grains that travel far. Insect-pollinated plants often produce less pollen and deposit much of it locally. Pine grains can be overrepresented; some delicate or rare types are easily missed. Researchers learn the dispersal behaviour of modern plants, compare surface samples with known vegetation and use models that account for productivity and transport. Interpretation focuses on assemblages and trends, not a one-to-one equation between ten percent pollen and ten percent landscape cover.
Where archaeologists collect samples
Regional vegetation histories often come from lake or bog cores because sediment accumulates sequentially. Archaeological questions may use floor deposits, storage vessels, hearth surroundings, burials, field soils, wells or material attached to tools. The best context is sealed, dated and linked clearly to human activity. Samples are taken with clean tools and documented in three dimensions. Control samples help identify background pollen or modern contamination. A handful of sediment removed without stratigraphic information may contain identifiable grains but answer little. Palynology is strongest when sampling is designed alongside excavation rather than added after contexts have been disturbed.
Laboratory preparation concentrates the evidence
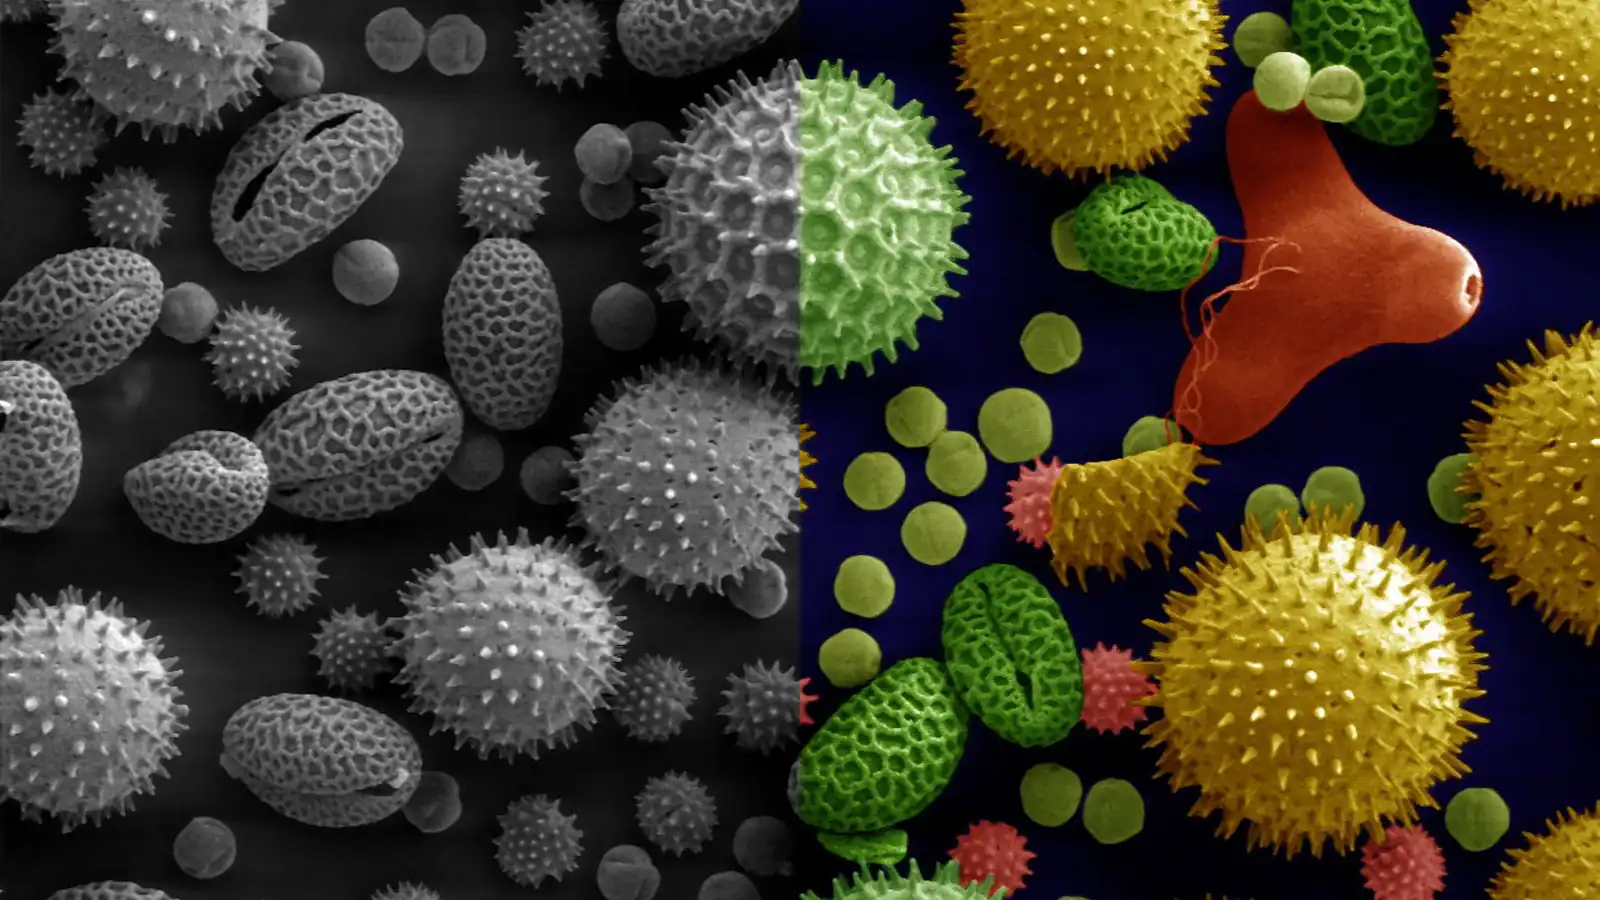
Sediment contains minerals, organic debris and many particles besides pollen. Laboratories use controlled chemical and physical treatments to concentrate resistant grains. Protocols vary with sediment and research goals. Because reagents can be hazardous, this is trained laboratory work with strict safety procedures, not a casual home experiment. Samples are mounted on slides and examined under transmitted light; scanning electron microscopy can reveal finer surface detail. Analysts move systematically across a slide, identifying and counting grains until the sum is large enough for meaningful comparison. Reference collections and published keys support identifications.
Shape functions like a botanical clue
Palynologists examine size, symmetry, apertures and ornamentation. Apertures are thinner regions where germination can occur; their number and arrangement are useful taxonomic characters. Surface textures may be smooth, spiny, netted or grooved. Some plants have distinctive pollen, while related species share features too similar for confident separation under light microscopy. Analysts report the level the morphology supports, such as oak type or grass family, rather than forcing a species name. Damaged and folded grains complicate measurement. Expertise includes knowing when a grain cannot be identified reliably.
A core becomes a sequence through time
Researchers divide a sediment core into depth intervals and establish an age model using radiocarbon dates, annual laminations, tephra or other markers. Pollen counts are expressed as percentages or accumulation rates and plotted by depth or age. Zones mark substantial changes in the assemblage, but boundaries are analytical summaries, not moments when an entire landscape switched instantly. Sediment can be mixed by burrowing organisms, roots or erosion. Age uncertainty grows between dated levels. A responsible diagram shows chronology, sample resolution and count quality so readers can distinguish a sharp event from a change that only appears sharp because samples are widely spaced.
Climate leaves indirect botanical signatures
Plants occupy environmental ranges shaped by temperature, moisture, seasonality, soils, competition and disturbance. When climate changes, distributions and abundance can shift, altering pollen assemblages. Researchers compare fossil pollen with modern relationships or use process-based models, while recognizing that past plant communities may have no exact modern equivalent. Carbon dioxide, fire, herbivory and migration speed also affect vegetation. Pollen therefore provides climate information indirectly through ecological response. Confidence rises when pollen patterns agree with independent proxies such as lake levels, isotopes, insects or glacier records.
Farming transforms the pollen rain
Agriculture can increase cereal-type pollen, weeds associated with disturbed ground and plants favoured by grazing. Forest clearance may reduce tree pollen and increase grasses or herbs. Yet cereal pollen can resemble wild grasses, and grazing indicators are not universal. Analysts combine pollen with charcoal, fungal spores associated with herbivore dung, seeds, phytoliths and archaeological evidence. A rise in open-land plants could reflect cultivation, natural fire, flooding or climate. The question is not whether one “farming grain” appears, but whether several indicators change in a sequence consistent with dated settlement and land-use evidence.
Trees record management as well as clearance
Past communities did not simply preserve or remove forests. They coppiced trees, collected fodder, managed orchards, burned patches and encouraged useful species. These practices can create subtle pollen patterns. A decline in one tree with persistence of another may reflect selective use, but climate and disease are alternatives. High-resolution local records, wood charcoal and plant macrofossils help distinguish them. Archaeobotany increasingly treats landscapes as mosaics shaped by repeated decisions rather than as untouched nature replaced abruptly by farms. Pollen contributes a long view of those decisions, though it rarely identifies the exact social cause by itself.
Charcoal adds a history of fire
Microscopic charcoal is often counted on the same slides, while larger fragments may be analysed separately. Changes can indicate variations in burning, but source area and transport differ by particle size. Fire may be natural, accidental or deliberately used for land management. A charcoal peak followed by more disturbance-tolerant pollen can support a clearance interpretation. Repeated peaks may suggest a fire regime rather than a single event. Climate-driven dryness can also increase burning. Researchers compare timing with settlement evidence and regional records before assigning agency. Pollen and charcoal together reveal interaction, not an automatic fingerprint of human ignition.
Rare grains can be important—and risky
A single grain from an unusual crop, spice or distant species can be exciting, especially in a vessel or occupation layer. It can also be contamination, misidentification or long-distance transport. Strong claims require excellent context, repeated observations and careful comparison. Modern pollen enters through air, clothing, packaging and laboratory dust. Some old chemicals or slide collections contain contaminants. Analysts use blanks and controls and often seek confirmation from another specialist. The rarity that makes a grain historically interesting also makes statistical interpretation difficult. Extraordinary trade or diet claims should not rest on one ambiguous object.
Honey, food and artefacts hold local signals
Pollen inside ancient food residues, coprolites, dental calculus or containers may reflect plants used nearby, but pathways differ. Honey contains pollen gathered by bees and can indicate floral sources. Material on a grinding stone might come from processed plants or background dust. Context and taphonomy—the processes between deposition and discovery—determine meaning. Direct evidence can be powerful when supported by starch grains, phytoliths, proteins or macroremains. Analysts avoid assuming ingestion from mere presence. A grain has a biography: produced by a plant, transported, deposited, buried, preserved, recovered and prepared. Each step shapes the conclusion.
DNA can complement morphology
Sedimentary ancient DNA may identify organisms at finer taxonomic levels than pollen morphology, while pollen provides abundant, well-developed records. DNA preservation and transport introduce their own biases, and reference databases remain incomplete. The methods work best together rather than as rivals. A plant detected by both lines of evidence is especially persuasive; disagreement can reveal differences in source area or preservation. Imaging and machine learning may accelerate pollen classification, but algorithms need representative training sets and expert validation. Automated confidence scores do not eliminate the ambiguity of damaged grains or closely related taxa.
Source area changes with basin size
A small forest hollow mainly receives pollen from nearby vegetation, making it sensitive to local changes. A large lake integrates a broader region and can smooth local variation. Wind direction, basin shape and surrounding topography matter. Researchers select sites based on the desired spatial scale and may combine several cores. Models such as the relevant source area of pollen formalize how the relationship between assemblage and vegetation changes with basin size. This prevents a common mistake: treating every core as if it represents the same landscape radius. Scale is part of the evidence, not an afterthought.
Percentages can hide absolute change
Pollen percentages sum to one hundred. If one prolific taxon declines, the percentage of others can rise even if their absolute input stays constant. Accumulation rates—grains deposited per area per time—can help, but require reliable sedimentation rates and concentration estimates. Analysts examine both where possible. Statistical ordination and zonation summarize many taxa, yet visual inspection remains important. A dramatic percentage curve may reflect denominator effects, preservation or changing sediment supply. Good interpretation asks what quantity was calculated and how the archive formed before translating a line on a graph into a story about people or climate.
Cross-checking turns clues into history
Pollen conclusions become stronger when linked to seeds, wood, animal bones, soils, artefacts, settlement patterns and written evidence. A decline in tree pollen, rise in cereal types, charcoal increase and appearance of field boundaries together support clearance and cultivation far better than any component alone. Conversely, a pollen change without local archaeological activity may point toward climate or a regional process. Interdisciplinary disagreement is useful because each archive has different biases. Reconstructing a lost landscape is not filling blank space with the most appealing narrative; it is testing which narrative explains the largest set of independent observations.
What a pollen record cannot say
Pollen rarely identifies exact field boundaries, ownership, population size or cultural identity. Many plants cannot be resolved to species. Long-distance grains complicate presence claims, while absence can result from low production or poor preservation. Chronologies contain ranges. Human and climatic causes often overlap. These limits should shape headlines and captions. Palynology can show that vegetation opened, crops appeared or fire patterns changed; archaeology and other evidence must establish who acted, how and why. Precision comes from matching a claim to the resolution of the method rather than treating every microscopic grain as a complete historical witness.
Why the method remains indispensable
Pollen is widespread, durable and sensitive to ecological change. A single core can span millennia, connecting environmental history with the rise and movement of communities. The work is painstaking: sample selection, chemistry, microscopy, taxonomy, counting, dating and statistics all introduce decisions that must be documented. Yet the reward is unusual continuity. Buildings and texts survive unevenly; pollen falls every season. Read with controls and companion evidence, those grains reveal forests advancing and retreating, wetlands forming, farms expanding and disturbance changing. Lost landscapes are not recovered as perfect pictures, but as testable reconstructions built from millions of small botanical traces.
Reference collections anchor identification
Modern reference slides link known plants with their pollen morphology. A useful collection records taxonomy, location, collector and preparation method, and may include several individuals because grains vary. Digital atlases expand access, but microscope focus and three-dimensional orientation still matter. Analysts compare fossil grains with multiple references rather than a single attractive image. Taxonomic revisions can also change names. Maintaining collections is therefore part of research infrastructure, similar to preserving museum specimens. The confidence of an ancient identification depends on the quality and breadth of the modern comparison set.
Training and quality control matter
Counting hundreds of grains can produce fatigue and observer differences. Laboratories use duplicate counts, inter-analyst comparisons and blind reference samples to assess consistency. Decisions about broken grains, clumps and uncertain types are documented. Statistical precision improves with count size, but simply counting more cannot fix biased sampling or poor preservation. Training combines botany, microscopy, geology and archaeological context. Machine assistance may reduce repetitive work, yet final interpretation still requires judgement about taphonomy and landscape scale. Reliable pollen evidence is created by procedures that make that judgement visible and repeatable.
Urban landscapes have pollen histories too
Cores beneath parks, ponds and buried wetlands can reveal vegetation that preceded modern streets. Construction, drainage and imported fill often disrupt sequences, so geoarchaeology is essential. Where intact deposits survive, pollen may document wetlands, farming or woodland at the edge of earlier settlements. Historical maps and records can then be compared with the biological archive. The method does not romanticize a single “natural” state; cities occupy landscapes that were already changing. Long records can inform conservation and restoration by showing which habitats persisted, which were transformed and how hydrology shaped both human choices and vegetation.
Open data lets old counts answer new questions
Regional pollen databases standardize site metadata, age models and taxonomic names so many records can be analysed together. Large syntheses reveal migration patterns and broad responses that one core cannot show. Harmonization is difficult: older studies used different names, sampling intervals and chronologies. Researchers retain links to original data and flag uncertain conversions. Reanalysis may change conclusions without invalidating the field; it shows why preserved counts and contextual notes matter. A carefully published dataset can outlive its first question and become part of continental reconstructions, model evaluation and future archaeological comparisons.
Reconstruction is strongest when it stays revisable
New dates, taxonomic knowledge or statistical models can change how an old sequence is read. Revisability is a strength because samples, counts and field notes allow later researchers to test the earlier interpretation. Museums and repositories preserve cores and slides for this reason. A persuasive study separates observation from inference: which grains were counted, how the layer was dated, what vegetation model was used and which historical explanation was proposed. When that chain is explicit, ancient pollen becomes more than an evocative trace. It becomes evidence that can improve as methods do.
Sources and further reading
- Smithsonian National Museum of Natural History, Archaeobotany and Archaeological Science
- U.S. Geological Survey, Paleoclimate Research
- Faegri and Iversen, Textbook of Pollen Analysis
- Sugita, Theory of quantitative reconstruction of vegetation
- National Centers for Environmental Information, Pollen data
- Neotoma Paleoecology Database
How Barnakle selects and verifies sources · Corrections and updates
Keep exploring.
One remarkable idea at a time—nature, science, history and beyond.
Sources and further reading
Barnakle uses credible primary and authoritative sources wherever possible.
- Smithsonian National Museum of Natural History, Archaeobotany and Archaeological Science
- https://naturalhistory.si.edu/research/anthropology/programs/archaeobiology
- U.S. Geological Survey, Paleoclimate Research
- https://www.usgs.gov/programs/climate-research-and-development-program/science/paleoclimate-research
- Faegri and Iversen, Textbook of Pollen Analysis
- https://doi.org/10.1002/jqs.3390040210
- Sugita, Theory of quantitative reconstruction of vegetation
- https://doi.org/10.1191/0959683607hl1032rp
- National Centers for Environmental Information, Pollen data
- https://www.ncei.noaa.gov/products/paleoclimatology/pollen
- Neotoma Paleoecology Database
- https://www.neotomadb.org/
Last reviewed September 21, 2026.

Barnakle Editorial Team
A member of the Barnakle editorial team, exploring remarkable ideas with clarity, curiosity and care.
More from this author →