
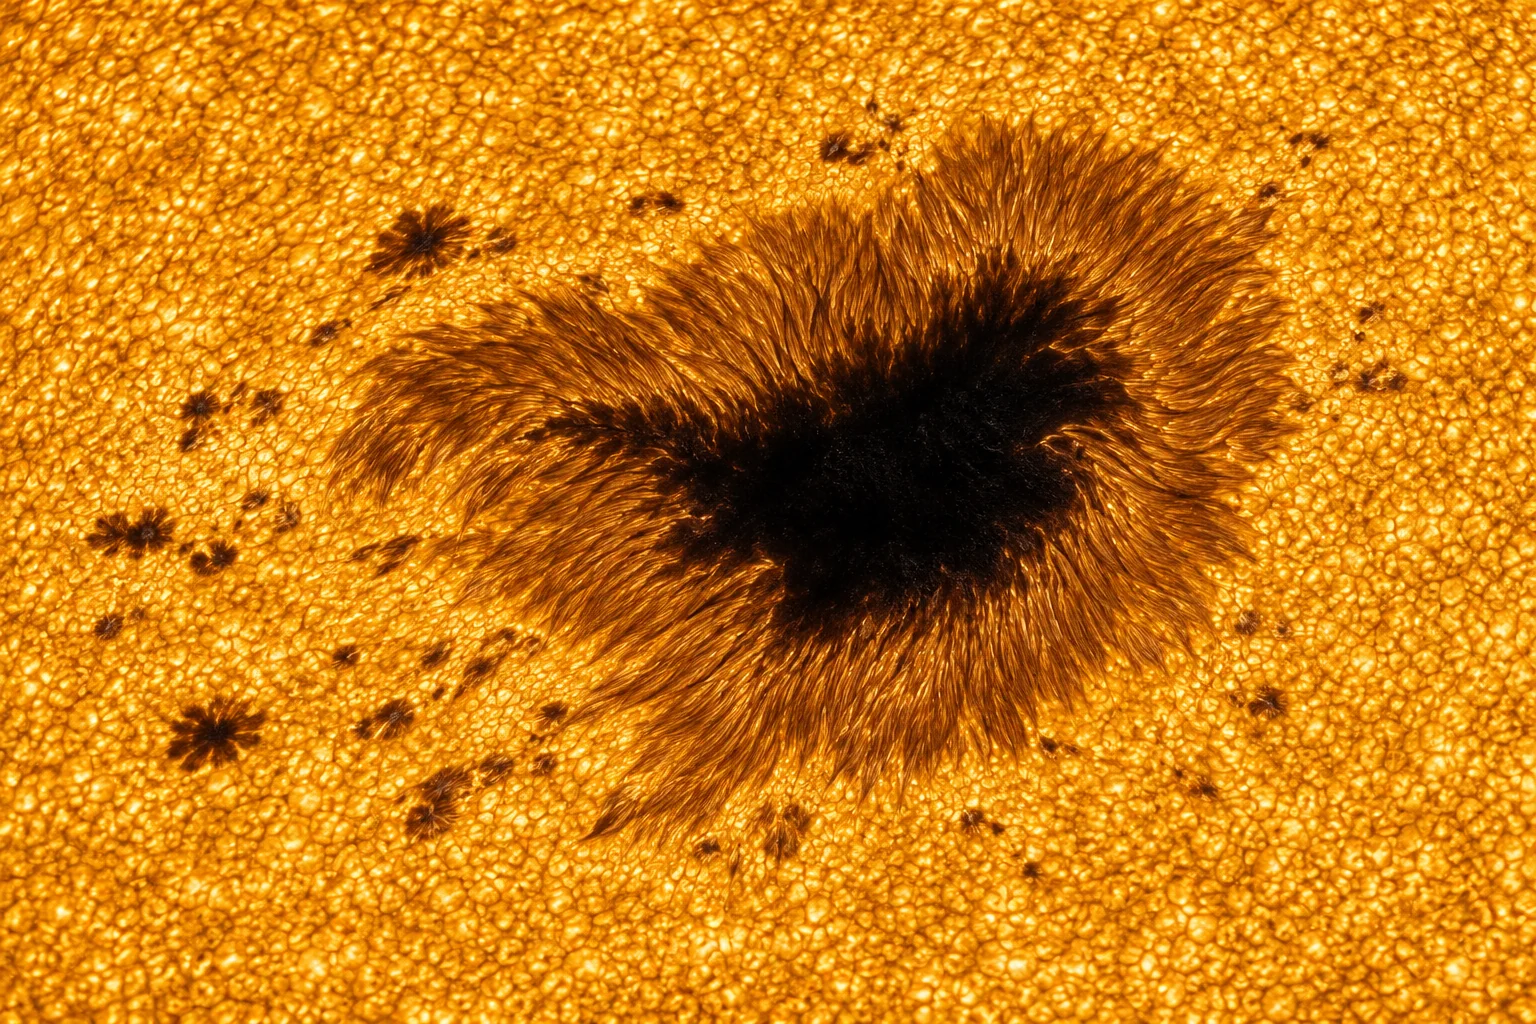
On a clear photograph of the Sun, a large sunspot can look like a thumbprint. In the next day’s photograph the same mark sits a little farther across the disc. Find a second group farther from the solar equator, follow both for several days, and their motions can give different answers to a seemingly simple question. How long does the Sun take to turn once? The equatorial surface goes round in roughly twenty-five days relative to the stars. At higher latitudes the surface takes longer.[1, 2, 5]
A solid object has to keep its parts together. Paint two dots on a spinning globe, one near the equator and one near the pole, and both complete a turn together. The equatorial dot travels a greater distance because its circle is larger. Its angular speed, measured in degrees per day, is exactly the same. The Sun is made of plasma. At its visible surface the angular speeds themselves differ with latitude, an effect called differential rotation. The distinction between an angle and a distance matters at every stage of measuring it.[2, 5]
Why a dark patch makes a useful marker
A sunspot is a region of concentrated magnetic field in the photosphere, the visible surface of the Sun. The region is cooler and therefore looks darker than its bright surroundings. A large group can remain recognizable across several daily images, long enough for an observer to follow its displacement. It has an advantage over the rapidly changing texture around it. There is a reasonable chance of recognizing the same feature tomorrow. But spots also emerge, split, change shape and fade. Every measurement begins with a judgement about identity.[1, 3]
Consider a group with one large round spot and three small companions. If one companion disappears overnight, the middle of the visible group can move even if the large spot follows its usual course. Tracking the centre of the large spot and tracking the centre of the whole group can therefore yield different positions. An observer should use the same feature from frame to frame and record when it changes enough to make the comparison doubtful. Longer runs and independent measurements help reveal these small uncertainties.[2, 3]
Why a ruler on the photograph gives the wrong speed
A sunspot near the middle of the visible disc seems to travel farther across the page in one day than it does near the edge. To see why, place evenly spaced marks along the equator of a globe and view it from one side. The marks appear far apart near the middle. Near the outline they crowd together because the surface curves away from you. Equal intervals in longitude do not make equal intervals in millimetres on a flat image. A steadily rotating spot can therefore appear to accelerate towards the centre.[2, 3]
Astronomers put a solar coordinate grid on the image to recover the angles. The grid must account for which way solar north points and how far the Sun’s axis tips towards or away from the observer. A date and a known image orientation are as important as a sharp outline around the spot. The Greenwich photographic records give a sense of the care involved. In the 1950 observations two measurers independently determined spot positions from photographs, making it possible to compare readings of the same features.[2, 3, 5]
Two clocks for one trip around the Sun
Suppose a recognisable mark advances thirteen degrees a day across an observer’s grid measured from the centre-facing meridian. If that rate held, it would take about 27.7 days to advance 360 degrees in that frame. During those days Earth also travels along its orbit in the direction of the Sun’s rotation. By the time the spot has turned once relative to distant stars, Earth is looking from a new direction. The spot must turn a little farther to come back to the same position facing Earth.[2, 5]
The return interval seen from Earth is called synodic. The interval relative to distant stars is sidereal. For an approximate calculation, Earth advances nearly one degree per day around the Sun. Add that degree to the illustrative thirteen and the estimated sidereal rate is about fourteen degrees per day. Dividing 360 by fourteen gives roughly 25.7 days. Both answers describe the same hypothetical spot. Quoting either figure without its reference frame could make two observers appear to disagree about a motion they measured perfectly well.[2, 5]
The latitudes the spots leave blank
To compare latitudes, observers gather several tracks in each latitude band and use the same time convention throughout. Sunspots present a sampling problem. They tend to occupy belts on either side of the solar equator, and the typical latitude of emergence changes through the solar activity cycle. A sequence rich in low-latitude spots might have no useful high-latitude comparison at all. Waiting for a spot at the pole is a poor plan for measuring the polar rotation rate.[1, 4]
The records support other questions as well. Count groups by date and latitude over many cycles and their shifting belts produce the famous butterfly diagram. Follow an identifiable group over a few days and you are measuring rotation. A dot on paper may stand for a spot in either kind of plot, but the horizontal scale and the question are different. The migration of the belts over years would be a very misleading speed to assign to an individual spot crossing the visible disc.[3, 4]
For a look at the effect, a sequence of dated solar images is more revealing than a single spectacular close-up. First follow one durable spot across three or four images. Then look for a second group at a different latitude and compare the angles each covers. The dates on the images give you the elapsed time, even when a day in the sequence is missing. If a group fades before there are enough measurements, leave its track incomplete. The Sun supplies plenty of markers over time, but each belongs to a particular place on a turning, changing surface. That is why a solar rotation period needs a latitude as well as a clock.[1, 2, 5]
Related reading
Sources
- NASA Science — Sunspots
- ESA CESAR — Measuring the Sun’s differential rotation
- Royal Greenwich Observatory — Greenwich Photo-Heliographic Results, 1950
- David Hathaway — The Solar Cycle
- NASA Marshall Space Flight Center — Solar rotation
Keep exploring.
One remarkable idea at a time—nature, science, history and beyond.
Last updated November 21, 2026.

Barnakle Editorial Team
Barnakle Editorial Team is the collective byline used for Barnakle’s editorial articles. The contributor profile explains the team identity and links to the publication’s editorial policies.
More from the editorial team →