
Reading climate history one frozen layer at a time
What to know
- Air bubbles provide direct samples of past atmosphere.
- Water isotopes are temperature-related proxies, not simple thermometers.
- Volcanic sulfate and annual layers help date and align cores.
- Flow, diffusion and gas enclosure create measurable uncertainty.
An archive made from snowfall
In the cold interiors of Greenland and Antarctica, some snow survives summer. New layers bury old ones, compressing loose crystals into firn and eventually dense glacial ice. The sequence can preserve snowfall chemistry, windblown dust, volcanic material and tiny bubbles of ancient air. Scientists recover cylinders called ice cores and read their properties as overlapping records rather than as a single thermometer. The deepest cores contain ice hundreds of thousands of years old. Their value comes from combination: gases reveal past atmosphere, water isotopes track aspects of temperature and moisture history, and particles record events and circulation. Together they make ice one of Earth’s most detailed natural climate archives.
From snowflake to sealed bubble
Fresh snow is mostly air. As burial increases, grains round and pack more tightly. Passages between pores gradually close, trapping air in bubbles. The ice surrounding a bubble is older than the gas inside because air continues mixing through open firn after the snow fell. Scientists model and measure this gas-age–ice-age difference, which varies with accumulation and temperature. It is crucial when comparing carbon dioxide with temperature proxies. The archive is therefore not a stack of perfectly sealed annual envelopes from the start. It is a transforming material whose physical history must be understood before its clocks can be aligned.
Why polar ice survives
A useful core requires long-term preservation. Near the centre of a large ice sheet, annual snowfall can accumulate while summer melting remains limited. Ice slowly spreads under its own weight, and the oldest layers may thin dramatically near bedrock. Mountain glaciers can also preserve valuable regional records, though flow, melting and terrain often complicate them. Researchers choose drilling sites using radar, surface measurements, flow models and knowledge of accumulation. A site with very old ice may have layers so compressed that annual detail is lost. A younger, high-accumulation site may offer exquisite year-by-year resolution but cover a shorter span. No location optimizes every scientific goal.
Drilling without losing the record
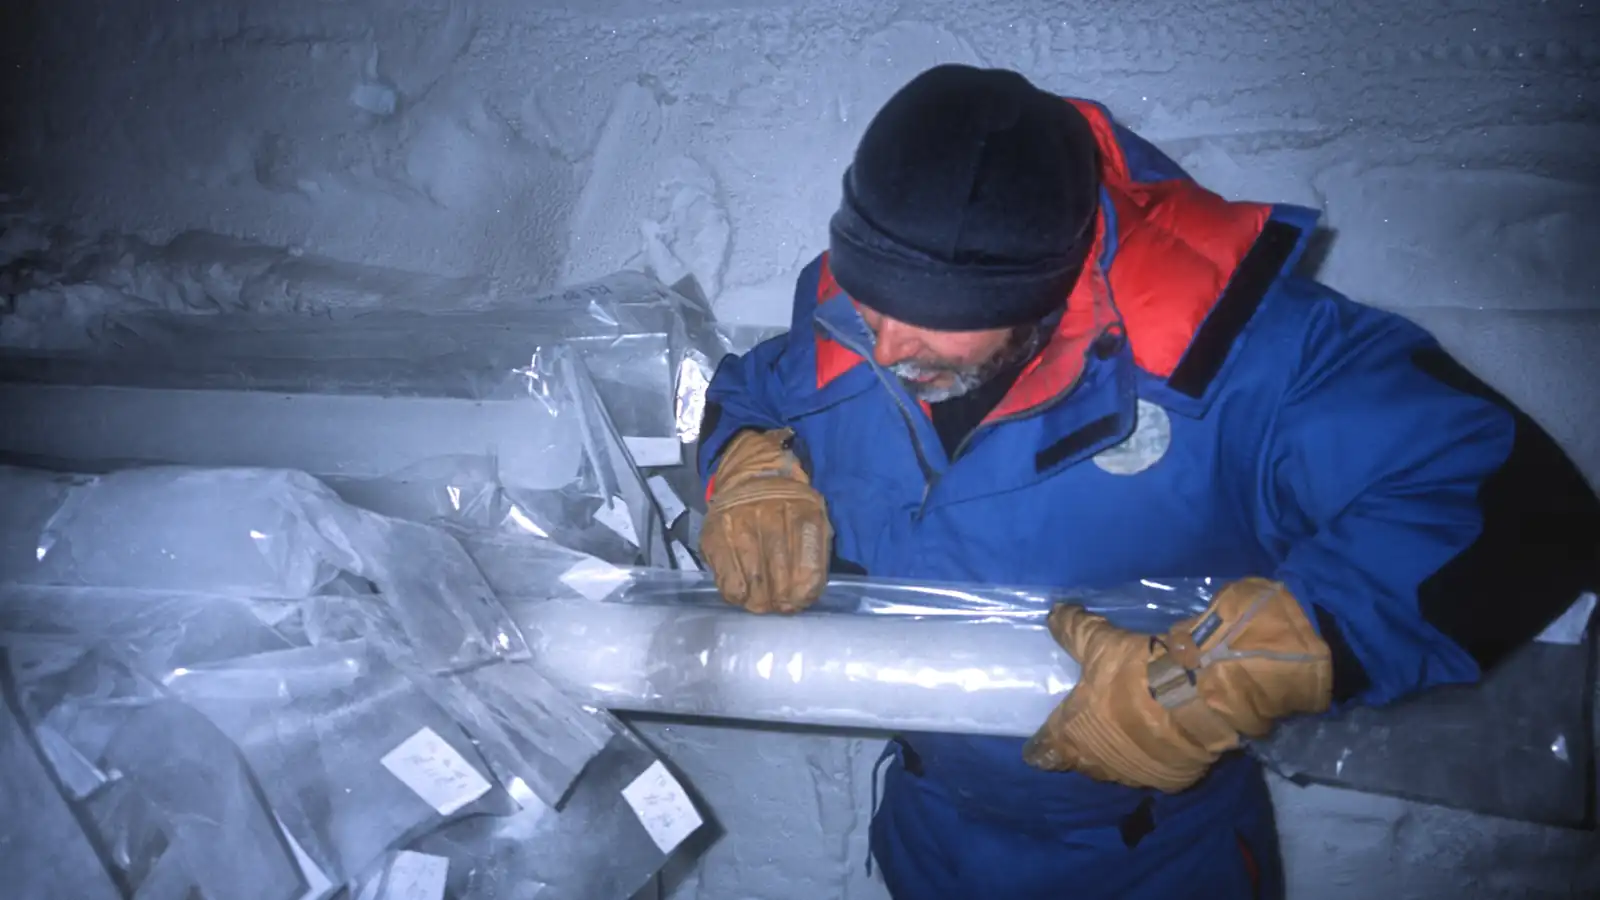
Ice-core drills cut an annular ring and retrieve a cylindrical section, often a few metres at a time. Deep drilling takes years and demands careful logistics in extreme environments. Teams record depth and orientation, prevent contamination, examine fractures and package sections for transport in a continuous cold chain. A core that warms can crack, lose gases or alter chemistry. Laboratories divide sections for different analyses, preserving archives for future instruments. International projects coordinate access because each metre is finite. The process resembles both field geology and precision laboratory work: the archive is natural, but trustworthy evidence depends on documentation from drilling tower to freezer.
Layers can become calendars
At favourable sites, seasonal differences in snowfall chemistry, dust, isotopes or electrical properties form visible or measurable annual layers. Researchers count them much as dendrochronologists count tree rings, while checking the chronology with known volcanic horizons and other markers. Uncertainty grows with depth as layers thin and flow distorts them. Farther back, scientists use ice-flow models and align patterns with independently dated records. Published age scales include uncertainties rather than pretending every depth has an exact birthday. Different teams may revise chronologies as measurements improve. Dating is a scientific result in its own right, not a label supplied automatically by the drill.
Water isotopes and temperature
Water contains common and rarer isotopes of hydrogen and oxygen. Evaporation, condensation and transport fractionate these isotopes in temperature-dependent ways. Ratios measured in ice can therefore provide information about past conditions, especially at the site and along the moisture pathway. The relationship is not a universal conversion from one isotope value to one temperature. Storm tracks, seasonality, source region, elevation and post-depositional processes also matter. Scientists calibrate modern relationships, use models and compare multiple proxies. Isotopes are powerful precisely because their physics is understood, but interpreting them requires attention to where the snow came from and how it arrived.
Ancient air can be measured directly
The bubbles are extraordinary because they contain samples of past atmosphere rather than an indirect biological proxy. In controlled vacuum systems, laboratories crush or melt ice and measure gases such as carbon dioxide, methane and nitrous oxide. Researchers correct for blank signals and verify standards. The results show natural greenhouse-gas variations across glacial cycles and the sharp industrial-era rise visible in recent records. Bubble measurements are not time travel without complications: enclosure is spread across a range of depths in the firn, and some gases can react or diffuse. Careful site selection and cross-laboratory comparison keep those limitations explicit.
Dust tells stories about wind and land
Mineral particles carried onto an ice sheet can reveal changes in aridity, exposed land, wind strength and atmospheric pathways. Particle concentration, size and elemental composition help researchers infer possible sources. Glacial periods often contain more dust in Antarctic cores than warmer intervals, reflecting a connected system of vegetation, sea level, dryness and circulation. A dust peak does not by itself identify one desert or one wind pattern. Source attribution may use isotopic fingerprints and atmospheric models. Dust also affects climate by interacting with radiation, clouds and ocean nutrients, making it both a recorder of environmental change and a participant in the climate system.
Volcanoes leave widespread markers
Explosive eruptions can inject sulfur-bearing gases and ash into the atmosphere. Sulfate deposited on ice may produce distinctive acidity or conductivity peaks, while visible ash layers can sometimes be matched geochemically to an eruption. These horizons help synchronize cores from different places and connect ice records with tree rings, historical accounts or marine sediments. Not every sulfate peak identifies a specific volcano, and deposition varies spatially. Researchers distinguish local ash from widely dispersed aerosols and avoid assigning names without supporting chemistry and chronology. Even unidentified events remain useful time markers and evidence of volcanic forcing.
Sea salt, fires and biological signals
Ice contains many other tracers. Sea-salt ions can reflect marine sources and transport, though wind and sea-ice processes complicate interpretation. Black carbon and certain chemical compounds can record combustion. Ammonium, organic acids and pollen may provide information about ecosystems or fires, especially in higher-accumulation regional cores. Human activity can appear through lead and other pollutants. Each substance has its own routes, reactions and preservation limits. Scientists rarely infer an entire environmental history from one curve. They look for coherent patterns among tracers, physical context and independent archives, separating a local deposition change from a broader shift whenever the evidence permits.
Annual resolution is not guaranteed
A glossy diagram often shows thick, even stripes, but real layers vary. Wind can scour or redistribute snow. Meltwater can percolate and move dissolved chemicals. Low-accumulation areas may record a year in millimetres. Deep layers thin as ice flows, and diffusion smooths some signals. These processes do not make cores useless; they determine which questions a particular core can answer. Recent centuries at a snowy site may be resolved seasonally, while very old Antarctic ice may preserve only broad patterns. Resolution is always stated alongside age range. The best archive is not necessarily the oldest one, but the one suited to the timescale of the question.
Ice moves after it is deposited
Glacial ice deforms and flows outward. Layers can tilt, fold or mix near bedrock, especially over rough terrain. Radar surveys map internal reflectors before drilling and reveal whether layering appears continuous. Flow models estimate thinning and the path travelled by ice. Researchers scrutinize the basal section because it may contain the oldest material but also the greatest disturbance. Claims of exceptionally ancient ice require evidence that stratigraphic order is preserved. Some projects instead seek “blue ice” areas where flow brings old material toward the surface; these can provide very old samples, though reconstructing a continuous chronology is harder.
How records from opposite poles connect
Greenland cores often show abrupt regional changes in the North Atlantic system, while Antarctic cores provide long records of Southern Hemisphere climate and greenhouse gases. Aligning them helps scientists examine leads, lags and connections across the planet. Methane variations can serve as shared atmospheric markers because methane mixes globally on timescales useful for synchronization. Volcanic horizons can also link records. Researchers then compare the timing of temperature proxies and gases without assuming they changed everywhere at once. This is one reason accurate gas-age and ice-age models matter: a mistaken alignment could create a false story about which part of the climate system changed first.
Ice cores and carbon dioxide
Long Antarctic records show carbon dioxide rising and falling with glacial cycles. These changes involved oceans, ecosystems, circulation, temperature and ice sheets; they were not caused by one simple switch. Orbital variations paced the cycles, while greenhouse gases amplified and transmitted climate changes. In the modern era, direct atmospheric measurements and ice records overlap, allowing methods to be checked. The present rise is much faster than the broad natural variations visible across those long records and is independently tied to fossil carbon through multiple lines of evidence. Ice cores contribute crucial context, but attribution does not rest on the bubbles alone.
What cores reveal about abrupt change
Some Greenland records contain transitions occurring over decades or less in regional indicators. These findings changed the old picture of climate as always moving gradually. Abrupt does not mean mysterious or globally identical. Ocean circulation, sea ice, atmospheric patterns and feedbacks can reorganize quickly, while other regions respond differently. Dating uncertainty and proxy response time must be considered before comparing events. The lesson is that climate contains thresholds and rapid processes as well as slow trends. Ice cores give scientists the resolution to investigate these episodes, test models and identify which mechanisms can reproduce their size, pattern and sequence.
Why several archives are better than one
Marine sediments, lake deposits, corals, cave minerals and tree rings each preserve different variables, locations and timescales. Agreement among independent archives strengthens an interpretation. Disagreement can expose dating problems, seasonal biases or genuine regional differences. Ice cores are especially valuable for atmospheric gases, but they do not directly record every ocean current or ecosystem response. Paleoclimate reconstruction is therefore a networked effort. Researchers build common chronologies, compare models with data and publish uncertainty. A single dramatic core graph may be memorable; the scientific power comes from how that graph fits with many other observations governed by different processes.
Contamination control protects tiny signals
Modern concentrations can overwhelm ancient traces. Scientists remove outer ice, work in clean rooms, use ultrapure tools and run blanks. Different sections may be reserved for gases, isotopes, particles, microbes or organic chemistry. A claim involving a rare compound must show that drilling fluid, packaging and laboratory air did not introduce it. Replication in another part of the core or another laboratory adds confidence. This attention is not bureaucratic fussiness. Some measurements detect quantities at parts-per-trillion levels. The deeper scientific question—what was present in the past—can only be answered after the modern pathway into the sample is understood and controlled.
Old ice still has limits
Ice cores sample particular places, often high polar plateaus, not a global average by themselves. Proxies require calibration and may respond to several influences. Gas ages have distributions rather than single exact values. Layers can thin or deform. Very old ice may lose fine temporal detail. These limitations are reported, modelled and tested; they are not reasons to dismiss the record. Indeed, the field advances by turning limitations into measurable uncertainties. A responsible reading distinguishes direct gas measurements from proxy inferences, local signals from global quantities, and precise recent chronologies from broader ancient ones. The archive is powerful because its boundaries are studied so carefully.
A frozen library that keeps being reread
Ice collected decades ago can answer questions that did not exist when it was drilled. Improved instruments need smaller samples and detect new compounds or isotopic relationships. Archived cores therefore remain scientific infrastructure. They also cannot be replaced quickly: drilling is expensive, and warming threatens some mountain and low-latitude glaciers. Preservation projects store material for future research while teams continue seeking older continuous records. An ice core is not simply a cylinder with a climate story printed inside. It is a physical archive whose pages are dated, calibrated and cross-checked. Reading it well combines glaciology, chemistry, physics, atmospheric science and patience.
Models and measurements challenge each other
Paleoclimate simulations are tested against the timing, magnitude and geographical pattern preserved in cores and other archives. A model that reproduces global temperature but misses abrupt regional events may be missing important circulation or sea-ice processes. At the same time, models help translate a local proxy into physically consistent large-scale interpretations. The relationship is iterative rather than a contest between “data” and “theory.” Measurements constrain models; models expose which measurements would discriminate among mechanisms; new cores then test those predictions. Ice becomes especially informative when it participates in this cycle instead of being treated as a self-explanatory curve.
Recent snow connects past and present
Shallow cores and snow pits overlap with weather stations, satellite observations and direct atmospheric sampling. That overlap lets researchers examine how temperature, storms and atmospheric chemistry become recorded in snow. Calibration is imperfect because wind and post-depositional change can redistribute signals, but modern monitoring identifies those effects. The same work supports interpretation of older layers where instruments did not exist. It also records recent pollution controls, nuclear-test markers and industrial emissions, providing chronological horizons and evidence of policy effects. The upper metres of an ice sheet are not merely an introduction to deep time; they are an active laboratory for learning how the archive writes itself.
Preserving uncertainty preserves value
The most useful reconstructions keep uncertainty visible at every stage: depth measurement, layer count, radiometric date, gas enclosure age, laboratory precision and proxy calibration. These uncertainties can be correlated, asymmetric and time-dependent, so a single plus-or-minus number may not capture them. Data repositories increasingly publish measurements, age models and metadata for reuse. Later researchers can apply improved chronologies without repeating the drilling. Transparency also prevents small timing differences from being exaggerated into claims about cause. An ice core’s authority does not come from appearing perfectly certain. It comes from a chain of evidence detailed enough for others to inspect, challenge and refine.
One core can support many sciences
A section may interest atmospheric chemists, volcanologists, microbiologists, glaciologists and historians of pollution for different reasons. Coordinating those uses protects scarce material and encourages results to be interpreted together. It can also expose conflicts: a layer identified chemically as volcanic may not match the date expected from historical records, prompting a review of both chronologies. Multi-purpose analysis makes the archive more than a climate thermometer. It becomes a record of interactions among atmosphere, ice, oceans, land, ecosystems and human activity, with each discipline contributing a different method for testing the same sequence.
Sources and further reading
- NOAA National Centers for Environmental Information, Ice Core data
- National Science Foundation, U.S. Ice Drilling Program
- EPICA Community Members, Eight glacial cycles from an Antarctic ice core
- Lüthi et al., High-resolution carbon dioxide record 650,000–800,000 years before present
- Jouzel et al., Orbital and millennial Antarctic climate variability
- British Antarctic Survey, Ice cores and climate change
How Barnakle selects and verifies sources · Corrections and updates
Keep exploring.
One remarkable idea at a time—nature, science, history and beyond.
Sources and further reading
Barnakle uses credible primary and authoritative sources wherever possible.
- NOAA National Centers for Environmental Information, Ice Core data
- https://www.ncei.noaa.gov/products/paleoclimatology/ice-core
- National Science Foundation, U.S. Ice Drilling Program
- https://icedrill.org/
- EPICA Community Members, Eight glacial cycles from an Antarctic ice core
- https://doi.org/10.1038/nature02599
- Lüthi et al., High-resolution carbon dioxide record 650,000–800,000 years before present
- https://doi.org/10.1038/nature06949
- Jouzel et al., Orbital and millennial Antarctic climate variability
- https://doi.org/10.1126/science.1141038
- British Antarctic Survey, Ice cores and climate change
- https://www.bas.ac.uk/data/our-data/publication/ice-cores-and-climate-change/
Last reviewed September 21, 2026.

Barnakle Editorial Team
A member of the Barnakle editorial team, exploring remarkable ideas with clarity, curiosity and care.
More from this author →